
What is TabTab
TabTab is the first full-link Data Agent, focusing onAI data analysisfield, achieving full-process automation from data collection to in-depth analysis through natural language dialogue. With powerful data integration, multi-dimensional mining, and professional metric analysis capabilities, it can accurately handle data analysis tasks in various scenarios, efficiently completing everything from complex industry data interpretation to detailed metric fluctuation tracking, helping users quickly obtain data insights and significantly improve decision-making efficiency. TabTab supports more daily office tools, including spreadsheet processing, AI documents, web page generation, and slide creation. You can assign corresponding tasks to TabTab according to your needs and let TA help you complete them!
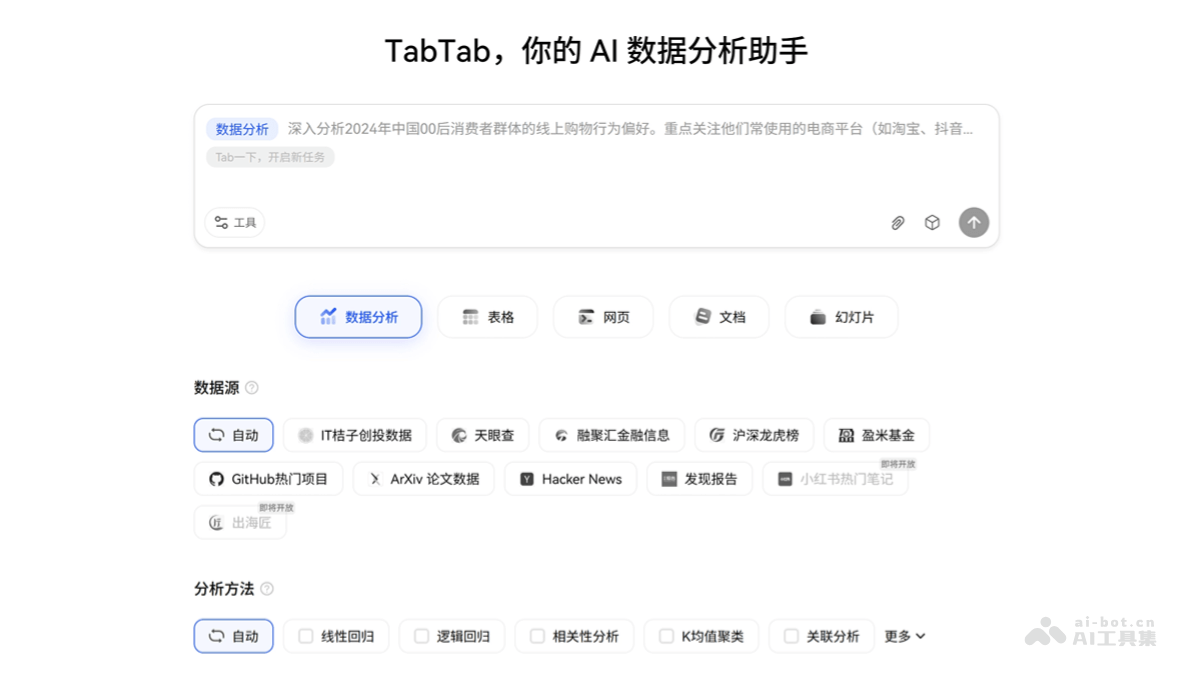
TabTab's main features
-
Natural language interaction: Users describe their needs in natural language, without writing code or mastering complex tools, and can complete data analysis tasks.
-
Multi-source data integration: Supports multiple data sources, including public domain data, private domain data (such as Feishu spreadsheets, MySQL, etc.) and vertical domain data (such as Tianyancha, IT Juzi, etc.), automatically completing the integration of multi-source heterogeneous data.
-
Automated data analysis: Automatically completes data cleaning, basic modeling, and chart drawing, saving users time and effort and allowing them to focus on in-depth business interpretation.
-
Model interpretability report: Automatically generates detailed model interpretability reports to help users understand analysis results, and supports advanced analysis methods such as decision trees.
-
Visual chart generation: Provides a variety of visual charts, such as Sankey diagrams, bar charts, etc., to intuitively display key data information, and supports export to Excel, PPT, and web page formats.
-
Efficient task delivery: Adopts an intelligent multi-agent architecture to efficiently schedule tasks, accurately understand user intent, and quickly deliver analysis results.
How to use TabTab
- Visit the platform: Visit the TabTab official website https://tabtabai.com/ , click Start Using, register or log in directly, and enter an invitation code to use it.
-
Submit requirements: Users describe their data analysis needs in natural language, without writing code or mastering complex tools.
-
Data integration: TabTab AI automatically connects to and integrates multiple data sources, including public domain, private domain, and vertical domain data.
-
Automatic analysis: The system automatically completes data cleaning, basic modeling, and chart drawing, and generates preliminary analysis results.
-
Generate reports: Automatically generates detailed model interpretability reports, including visual charts and key information annotations.
-
Export results: Users can export analysis results to Excel, PPT, or web page formats for further editing and reporting.
-
Adjust and optimize: Manually adjust the analysis method or further optimize the report content as needed to ensure the analysis results meet business requirements.
TabTab usage examples
Example 1:
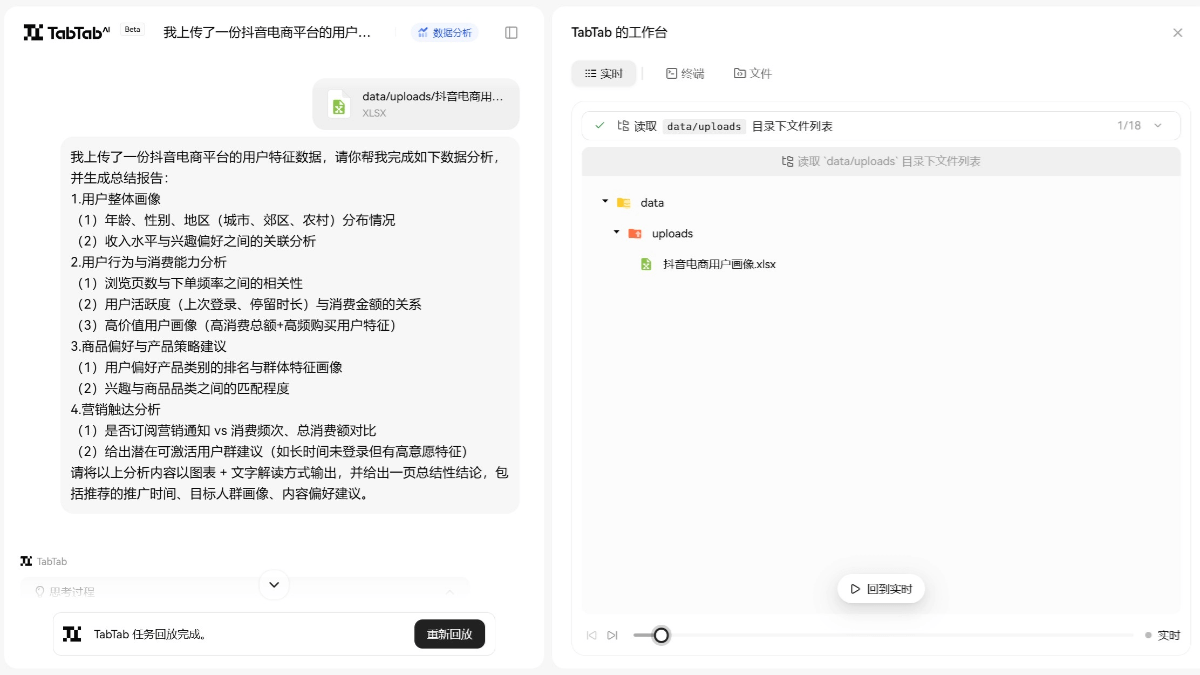
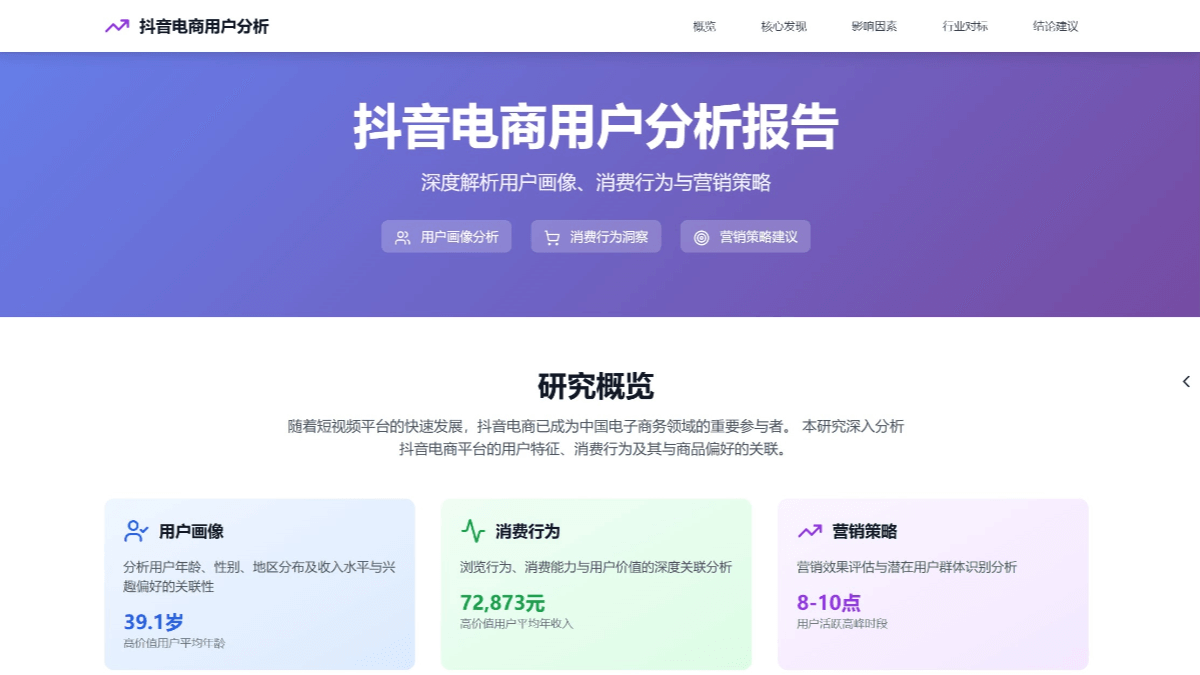
I uploaded a set of user characteristic data from the Douyin e-commerce platform. Please help me complete the following data analysis and generate a summary report:
1. Overall user profile
2. Analysis of user behavior and spending power
3. Product preferences and product strategy recommendations
4. Marketing reach analysis
Please output the above analysis content in the form of charts + textual interpretation, and provide a one-page summary conclusion, including recommended promotion timing, target audience profiles, and content preference suggestions.
Example 2:
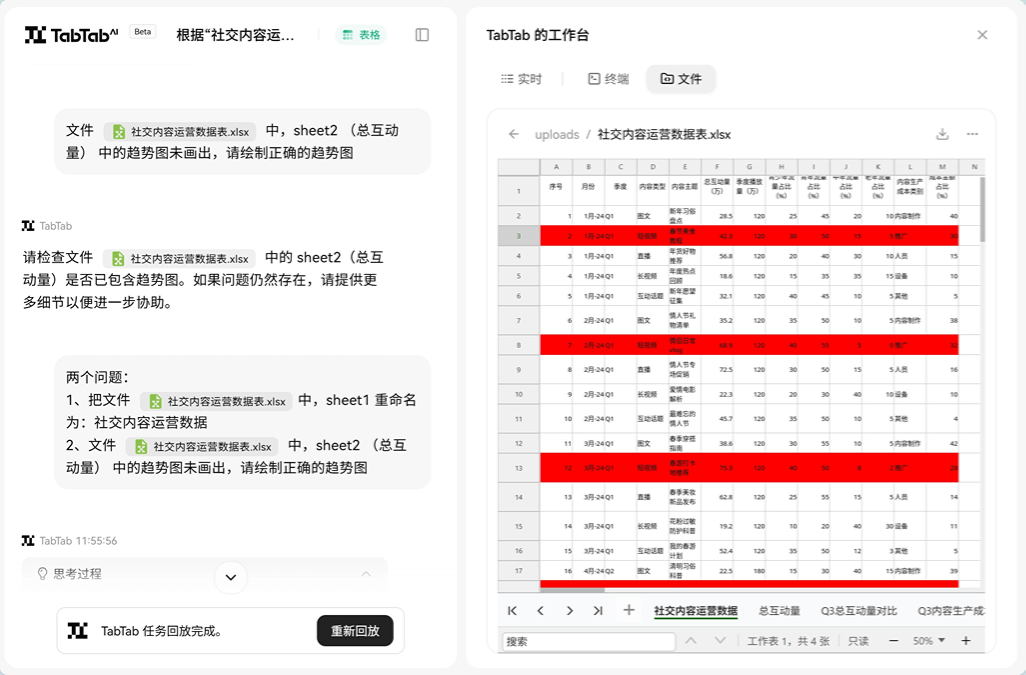
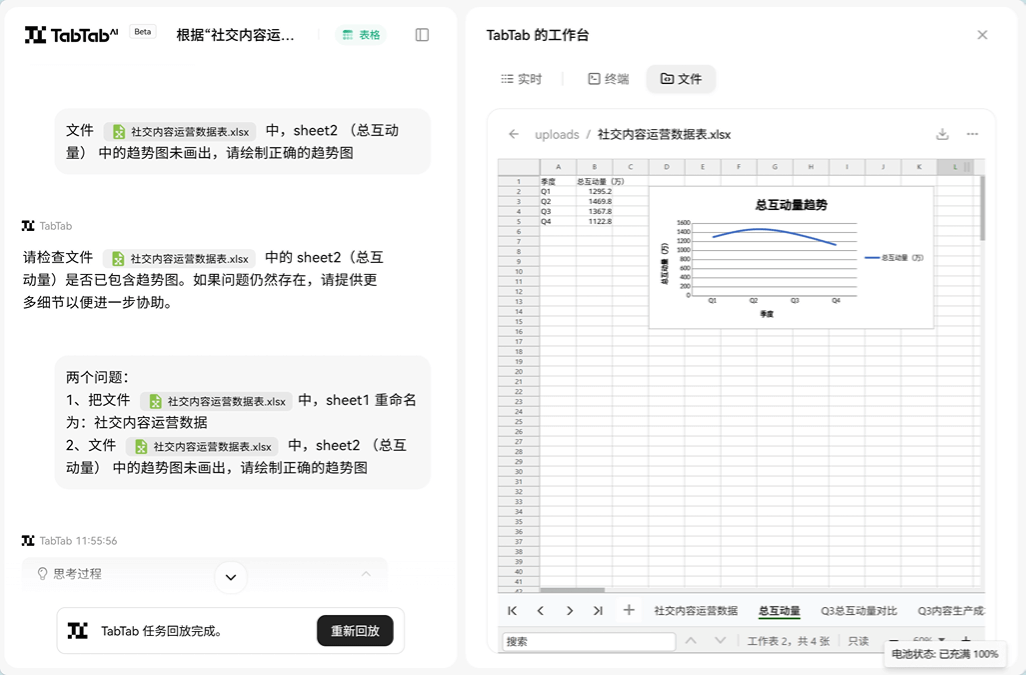
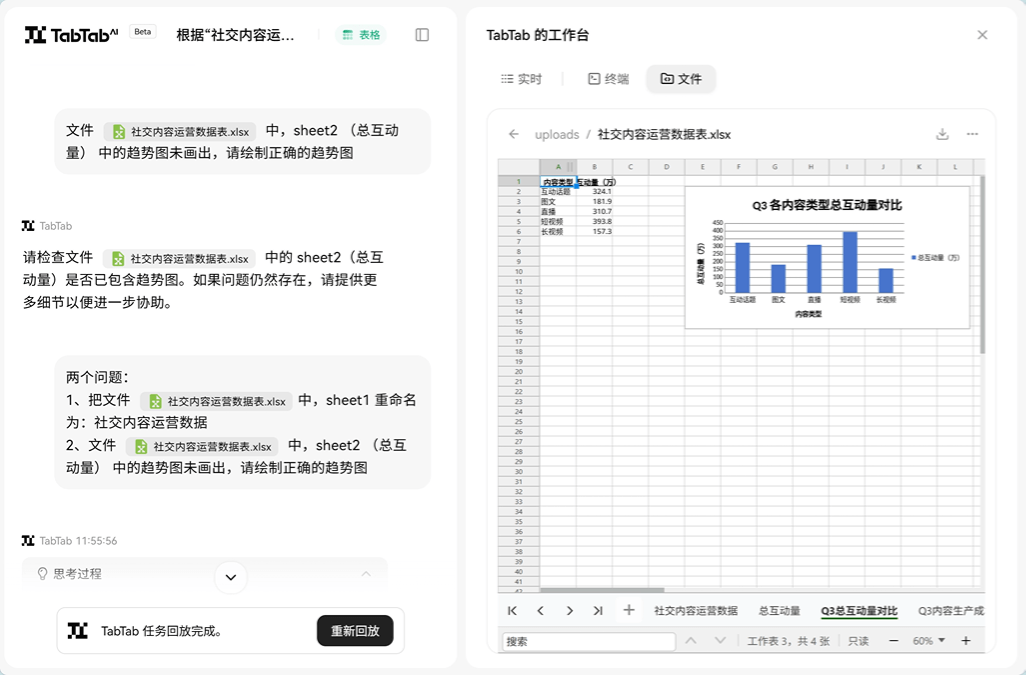
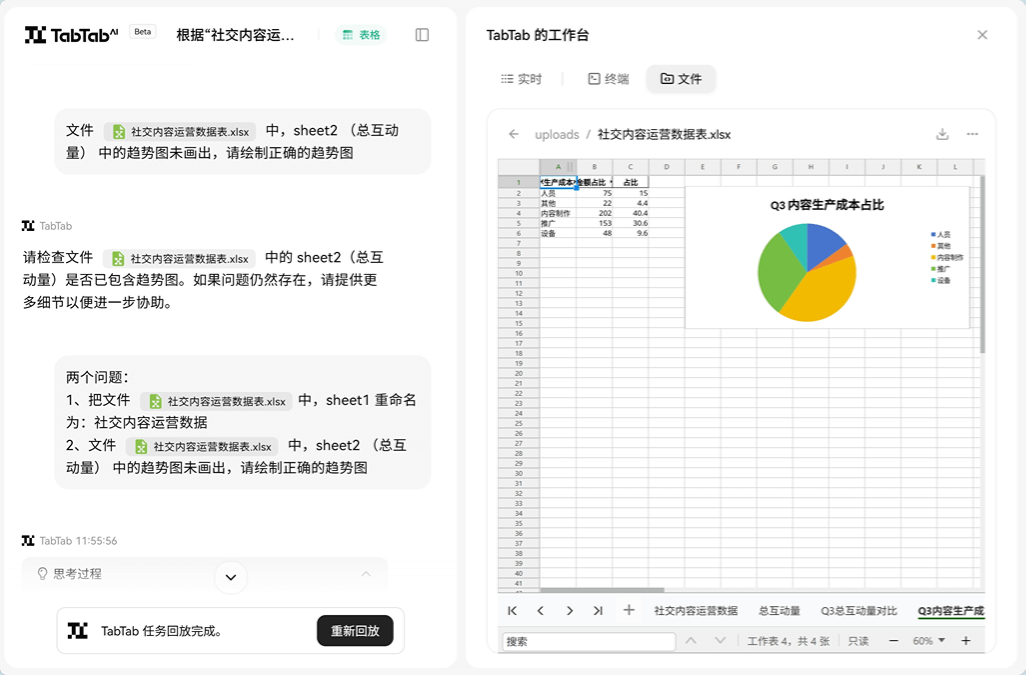
Based on the data in the "Social Content Operations Data Table," help me perform the following data processing:
1. Mark all records whose content type is "short video"
2. Help me calculate the total interaction volume, and draw a trend chart of total interaction volume from Q1 to Q4
3. Compare how much total interaction volume each content type has in Q3
4. Help me calculate the percentage of total cost accounted for by the "content production cost category" for each type in Q3
TabTab's target users
-
E-commerce operations personnel: Can quickly analyze user behavior data, optimize campaign strategies, and improve conversion rates.
-
Market analysts: Can efficiently process multi-source data, generate professional reports, and support decision-making.
-
Knowledge workers: Can complete daily data tasks without mastering complex data analysis tools.
-
Product managers: Use data analysis to drive product improvements, such as optimizing button placement to increase conversion rates.
-
Novice users: Even people who are not very familiar with data analysis can easily get started and quickly generate charts and reports.
-
SMB customers: Small and medium-sized enterprise customers who need efficient, easy-to-use data analysis tools to support business development.