
In this data-driven era, insight has become the key to enterprise competition. Not every organization has the resources to invest in expensive data analysis and visualization tools. With the rapid development of artificial intelligence technology, a series of free AI tools have emerged. This article will introduce 10 free AI data analysis tools and software that can help users extract valuable information from massive data and generate visual charts with one click. They are changing the way data analysts, researchers, and even ordinary users work, making complex data analysis and visualization within reach.
1. Office Raccoon
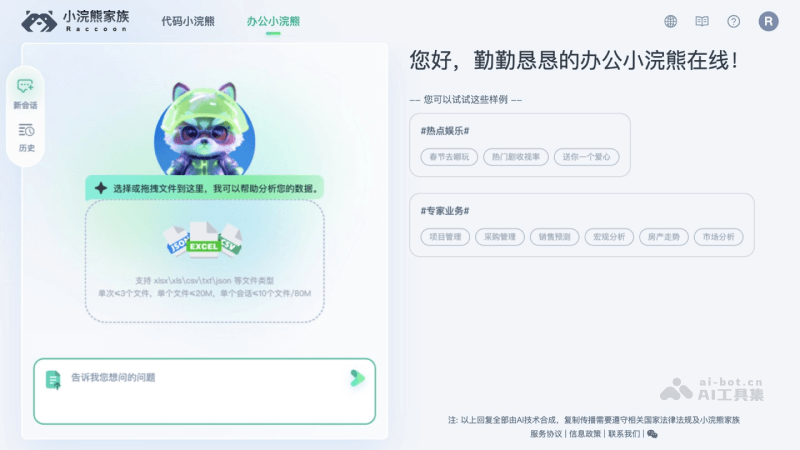
Office Raccoonis an AI data analysis tool launched by SenseTime. Based on SenseTime's self-developed large model, it can automatically transform data into meaningful analysis and visualization results through natural language input. The tool supports the analysis and understanding of complex tables, multiple tables, and multiple files, and can complete data analysis tasks such as data cleaning, data computation, comparative analysis, trend analysis, predictive analysis, and visual chart generation. It supports a variety of file formats, including xlsx, xls, csv, txt, json, and more.
Product Features
- Natural Language Interaction: Users can submit data analysis requests through simple natural language input, without the need for complex programming or operational skills.
- Multi-Format Data Source Support: Supports a variety of data formats, including xls/xlsx/csv/txt/json, etc., and can handle data analysis for single tables, multiple tables, and multiple files.
- Multi-Turn Scenario-Based Dialogue: Based on the contextual understanding capability of SenseTime's large model, Office Raccoon can conduct multi-turn scenario-based dialogues, continuously improving and optimizing data analysis results.
- High-Precision Data Analysis: In data analysis tests, Office Raccoon achieved an accuracy rate of 85.71%, exceeding the industry average, demonstrating its professionalism and accuracy in data processing.
- Rich Visual Charts: It can automatically generate charts in various formats, such as bar charts, pie charts, line charts, radar charts, heat maps, etc., making data analysis results intuitive and easy to understand, and supporting download and export.
- Data Cleaning and Computation: Office Raccoon has data cleaning and computation capabilities. It can handle missing values and erroneous data in datasets, and supports comparative analysis and trend analysis of data.
- Predictive Analysis: It can perform trend forecasting and data analysis based on historical data, providing decision support for users in multiple application scenarios such as project management, procurement management, and market analysis.
Product Pricing
- Basic Edition: A free version for individual users, providing basic data analysis functions, fully sufficient for daily use.
- Professional Edition: Provides more comprehensive functions, including complex data analysis, etc. For more information, please log in to the official website.
2. ChatExcel
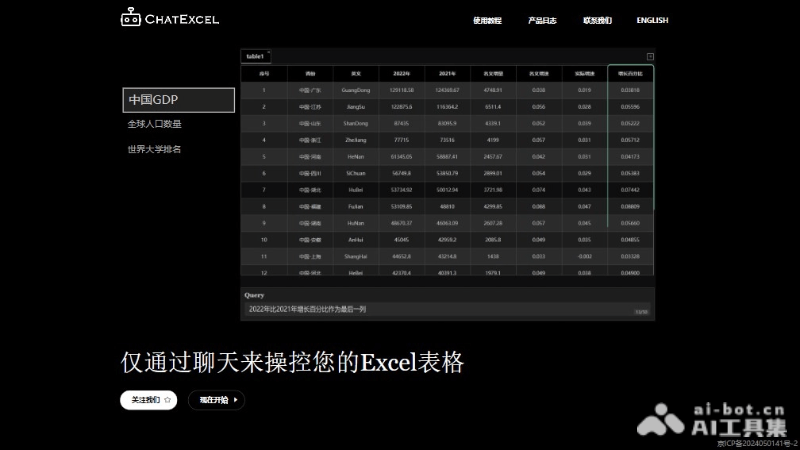
ChatExcelIt is an AI data analysis tool launched by a team at Peking University. Through natural language processing technology, it allows users to interact with Excel spreadsheets using everyday language and automatically perform operations such as sorting, filtering, and summing without writing formulas. The tool supports continuous interaction, letting users input new instructions based on the previous step's results to achieve iterative updates. ChatExcel is fully open and can be used without registration, supports one-click export to standard Excel files, lowers the barrier to using Excel, and is suitable for users who are not skilled at Excel operations.
Product Features
- Natural Language Processing: Users can issue instructions in natural language without needing to memorize complex Excel functions or formulas.
- Automated Operations: Supports automatically performing a variety of Excel operations, such as sorting, filtering, and summing, automating data processing.
- Continuous Interaction: Supports users in continuing to input new instructions based on the previous step's results, enabling multi-turn dialogue and iterative updates.
- One-Click Export: The processed Excel spreadsheet can be exported with one click, making it convenient for users to obtain the final results.
- Easy to Use: No programming knowledge is required, lowering the barrier to using Excel and making it suitable for users of all levels.
- Openness: No registration is required, users can directly use ChatExcel on the web page, and the number of uses is unlimited.
- Cross-Spreadsheet Collaboration: Can handle data integration and processing across multiple spreadsheets, improving the flexibility of data operations.
- Real-Time Updates: Updates spreadsheet content in real time according to user needs, improving the efficiency of data processing.
Product Pricing
- Free and open to use
3.Julius
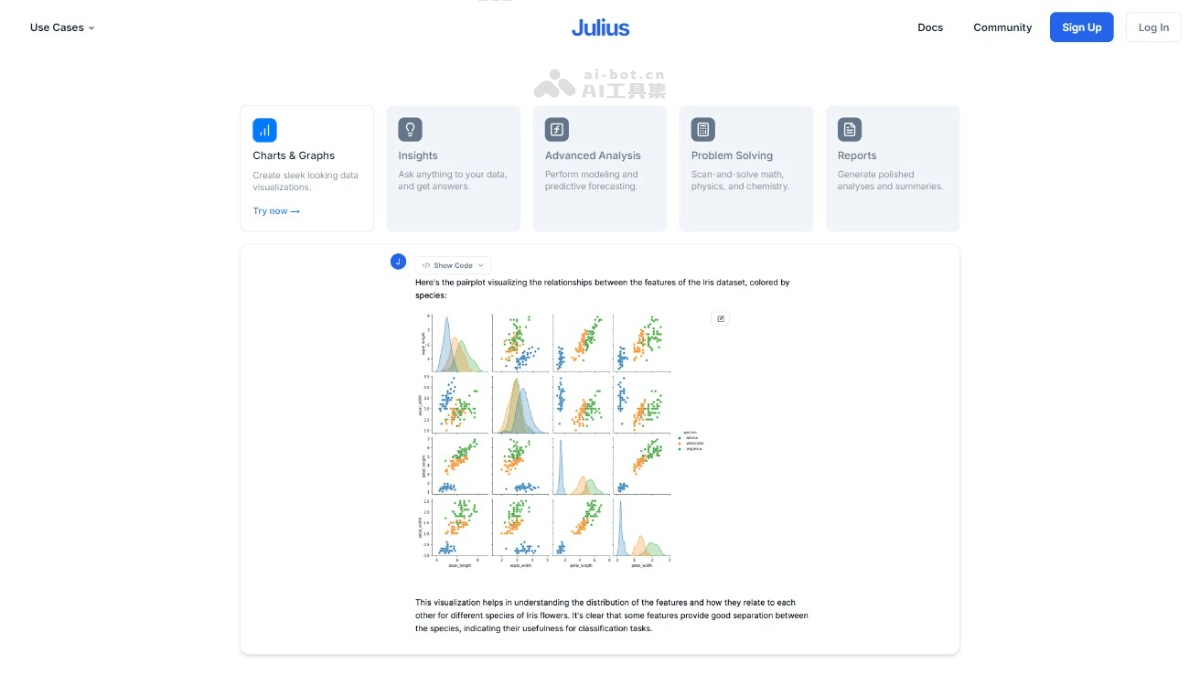
JuliusIt is an AI data analysis tool based on natural language processing technology that allows users to interact with data through natural language and quickly obtain analysis and visualization results. Users can upload data files in various formats and obtain instant analysis results from the data through a simple question-and-answer format. Julius has functions such as data cleaning, export, and statistical modeling, supports the generation of dynamic data displays, and improves the efficiency of data insights.
Product Features
- Natural Language Query: Users can directly ask the AI questions in simple language to obtain data analysis results, and non-professionals can also easily perform data analysis.
- Data Visualization: Julius AI can generate various charts and graphics according to user requests, visually displaying data, and supports creating data animations, making data presentation more vivid.
- Data Cleaning: Julius AI automates the data preparation process, reducing the workload of manually cleaning data and improving efficiency.
- Data Export: Analyzed data can be quickly exported to CSV or Excel format, making it convenient for users to further use or share.
- Statistical Modeling: Provides advanced statistical analysis functions, such as linear regression, supporting users in conducting complex data analysis without needing an in-depth understanding of statistics.
- Support for Multiple Data File Formats: Supports multiple data file formats such as spreadsheets, PDFs, images, and text files.
Product Pricing
- Free Plan: Users can send 15 messages per month for free to interact with the AI model.
- Basic Version: $10 per month, providing basic data analysis and visualization functions, suitable for individual users and small businesses.
- Professional Edition: $30 per month. In addition to the features of the Basic Edition, it provides advanced data modeling and predictive analytics, supports file-based conversations and complex problem-solving, and generates custom reports.
- Enterprise Edition: $100 per month. It provides comprehensive data analysis and visualization tools, including advanced feature support and dedicated customer service, customized data reports, and forecasting.
4. Kungfu Quant
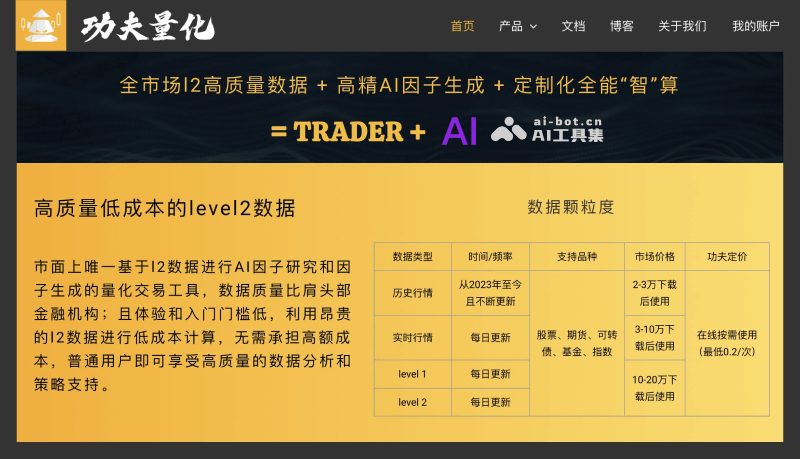
Kungfu Quantis an AI quantitative trading analysis platform that provides factor generation and an intelligent computing engine based on full-market Level 2 market data. Based on massive tick data and a variety of technical indicators, it accurately extracts key financial factors and supports markets such as stocks, bonds, and futures. The platform is characterized by enabling high-precision data analysis without programming, supporting real-time adjustment of trading factors, and adapting to market changes. It provides an intelligent computing engine and Python API to meet the needs of different users.
Product Features
- AI-driven factor generation: Based on artificial intelligence technology and combined with massive tick data, it identifies and extracts key financial factors to provide users with in-depth market analysis.
- High-precision market information: Provides analysis based on full-market Level 2 market data, ensuring that users can obtain real-time, accurate market value information and decision support.
- Intelligent computation without programming: Ordinary users can easily perform complex data analysis and calculations through the graphical interface and intelligent computing engine without programming skills.
- Flexible customized computation: Advanced users can perform customized complex calculations through the Python API interface to implement personalized trading strategies.
- Real-time adjustment and automation: Supports real-time adjustment based on market dynamics and the balance relationships among factors, and automatically generates and optimizes trading factors.
Product Pricing
- Log in to the official website for the latest information.
5. Polaris Nine Chapters
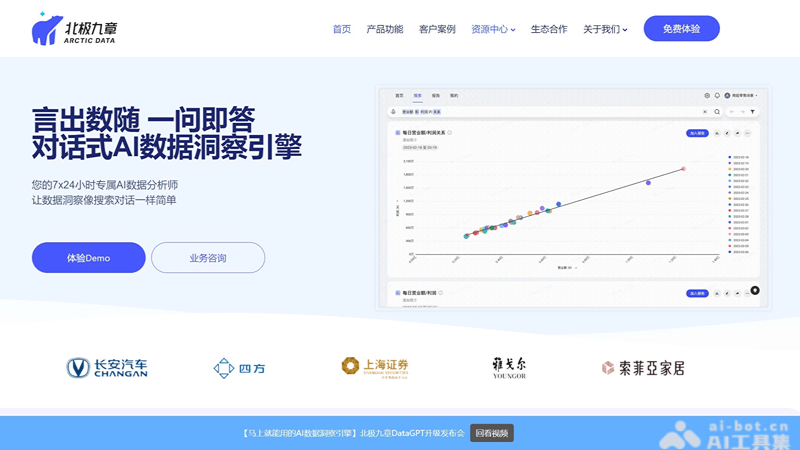
Polaris Nine Chaptersis a search engine platform focused on intelligent data analysis. Through natural language processing and big data analysis technologies, it helps users quickly obtain data insights and supports enterprise decision-making. The core product of Polaris Nine Chapters, DataGPT, enables users to interact deeply with databases in natural language through intelligent Q&A, automatically generate data analysis and form data insights, and empower business decisions.
Product Features
- Easy-to-use natural language interaction: Supports complex operations and long, difficult sentences, understands business needs, and supports English search.
- Intelligent insights: Automatically performs trend and predictive analysis, and can automatically perform multi-dimensional attribution to help users quickly locate problems.
- Multi-scenario applications: Supports embedding into communication software such as Feishu, WeCom, and DingTalk, as well as WPS office software, integrating data analysis into daily work processes.
- Large language model assistance: AI-assisted modeling improves data preparation efficiency, enhances semantic understanding, generates data interpretations, and suggests decision-making actions.
Product Pricing
- A free trial is provided. For specific pricing information, please log in to Polaris Nine Chapters.
6.MinusX
MinusXIt is an AI data analysis tool that, through natural language processing technology, enables users to perform data queries and analysis in a chat-based manner on platforms such as Jupyter and Metabase. It supports natural language queries, hypothesis validation, and content modification, and can seamlessly integrate into existing workflows. It focuses on data privacy, supports mainstream AI models, and aims to improve data analysis efficiency.
Product Features
- Natural Language Query: Users can ask questions in natural language without writing complex query code, making data analysis more intuitive and accessible.
- Hypothesis Generation and Validation: Users propose hypotheses, and MinusX helps perform data analysis to validate these hypotheses, accelerating the research and decision-making process.
- Content Modification: MinusX can be invoked via keyboard shortcuts to modify and extend existing data analysis content in Jupyter Notebooks or Metabase.
- Selection and Questioning: Users select specific areas in data or visualizations and ask related questions, and MinusX will analyze and answer based on the selected area.
- Seamless Integration: MinusX integrates into the data analysis tools users already use, without changing existing workflows such as Jupyter and Metabase.
Product Pricing
- It is currently free and open source on Github.
7.vika Vika Cloud
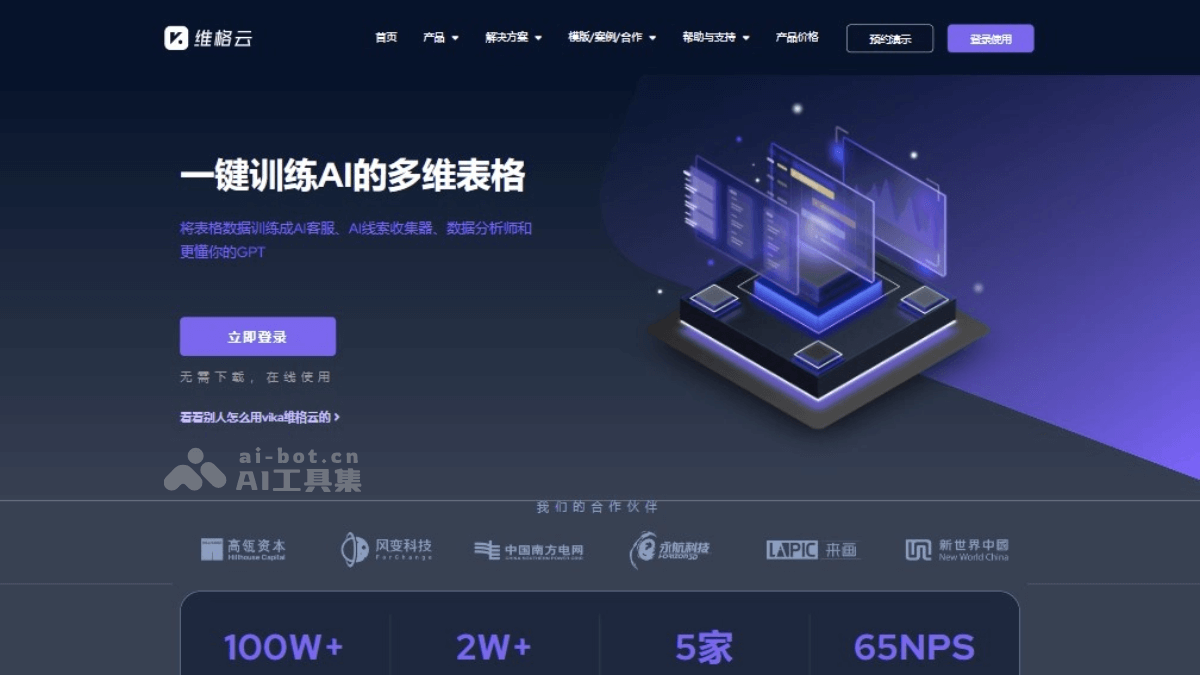
Vika Vika CloudIt is a multidimensional table data productivity platform that supports multi-person collaboration, data visualization, automated office work, and other functions, and is suitable for business scenarios such as project management and customer management. It provides a rich set of templates and API interfaces to enable cross-application data connections and help enterprises with digital transformation.
Product Features
- Data Visualization Capability: Vika Vika Cloud provides the ability to generate BI dashboards with one click, with data updated in real time, helping users easily grasp the overall situation. Through one-click generation of different views, such as gallery, kanban, Gantt, calendar, and more, users can intuitively manage and analyze data according to the needs of different business scenarios.
- Data Linkage Capability: Vika Vika Cloud supports data linkage, quickly collecting information and summarizing results through multi-field settings, achieving intelligent association and updates between data.
- Office Automation Capability: Through automation robots, Vika Vika Cloud can automate fixed processes, generate transaction reports in seconds, deliver related notifications on time, and execute data statistics periodically, thereby improving office efficiency.
- API Open Capability: Vika Vika Cloud provides API interfaces, supporting users to connect with other software through programming, enabling mutual data transmission and building efficient workflows.
- Customizable Business Adaptation Capability: Vika Vika Cloud supports users in customizing data collection forms, pivot tables, Excel append import, Word document generation, and more according to their own business needs, meeting personalized data processing needs
Product Pricing
- Free: Provides 1-5 seats; chatbot, assistant robot, AI forms, insights, document extraction, gallery view; kanban view; architecture view; 10 Gantt charts per space station; 5 calendar views per space station; 20 magic forms per space station, etc.
- Silver Level: Annual fee 6,800 yuan, providing 1-100 seats; chatbot, assistant bot, AI forms, insights, document summarization, gallery view; kanban view; architecture view; Gantt chart 50 per single workspace; calendar view 50 per single workspace; magic form 100 sheets per single workspace, etc.
- Gold: Annual fee 26,800 yuan, providing 1-200 seats; chatbot, assistant bot, AI forms, insights, document summarization, gallery view; kanban view; architecture view; Gantt chart 200 per single workspace; calendar view 200 per single workspace; magic form 300 sheets per single workspace, etc.
8.AEE
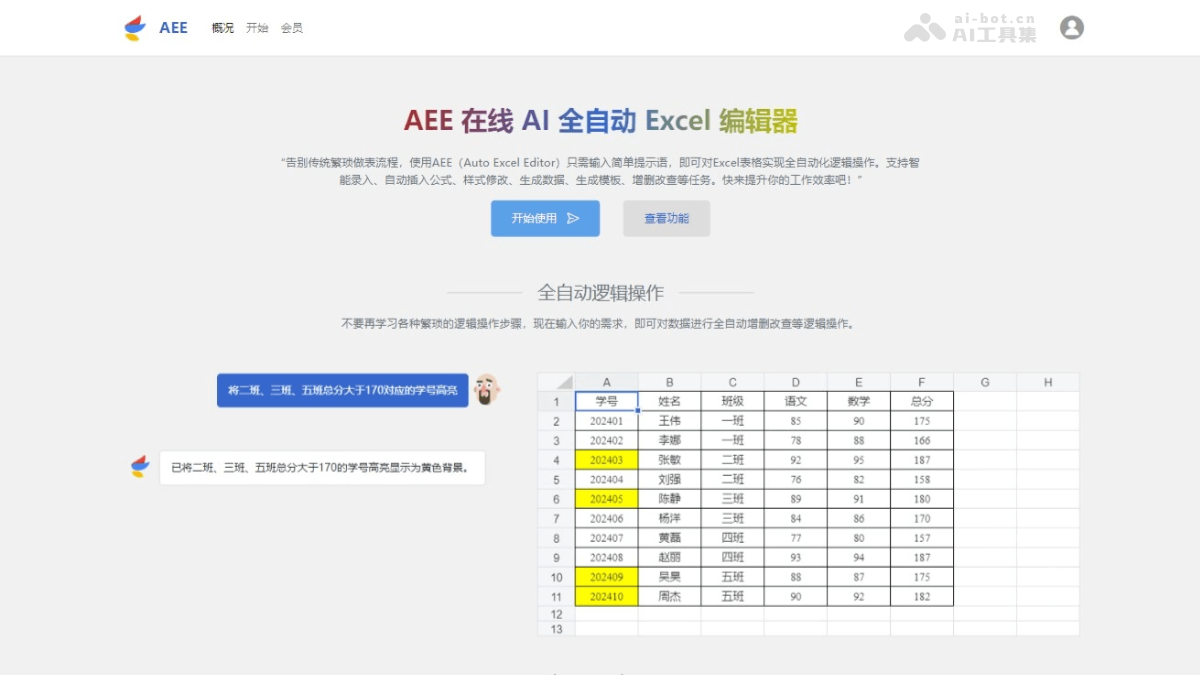
AEE(Auto Excel Editor) is an online AI Excel tool that enables fully automated logical operations on Excel spreadsheets. Users only need to enter simple instructions, and AEE can automatically complete tasks such as data entry, formula insertion, style modification, and data generation, greatly improving work efficiency. It is suitable for a variety of users, simplifies Excel operations, and makes data processing easy.
Product Features
- Fully Automated Logical Operations: By entering simple instructions, AEE can automatically execute logical operations such as adding, deleting, modifying, and querying data, without requiring users to master complex Excel formulas and functions.
- Automatic Formula Insertion: AEE can automatically insert appropriate formulas into Excel according to user needs, simplifying the process of calculation and data processing.
- Intelligent Data Entry: AEE can automatically identify data types and accurately enter them into the correct positions in Excel, reducing the workload of manual input and the possibility of errors.
- Style Modification and Template Generation: Users can easily adjust the style of Excel spreadsheets, and AEE also supports quickly generating data and templates, helping users efficiently create new Excel spreadsheets.
- Irregular Data Processing: AEE can process irregular data, organize it, and enter it into Excel, improving the efficiency of data organization.
Product Pricing
- Regular User: Free, providing 1-300 compute power trial per day, 800 single input bytes.
- Trial Experience Package: 9.9 yuan/3 days, 6,000 compute power, 20k single input bytes.
- Monthly Membership: 39.0 yuan/month, 50,000 compute power, 20k single input bytes.
- Custom Development: 1,200.0 yuan/starting from, unlimited compute power/day, unlimited single input bytes.
9.Graphy
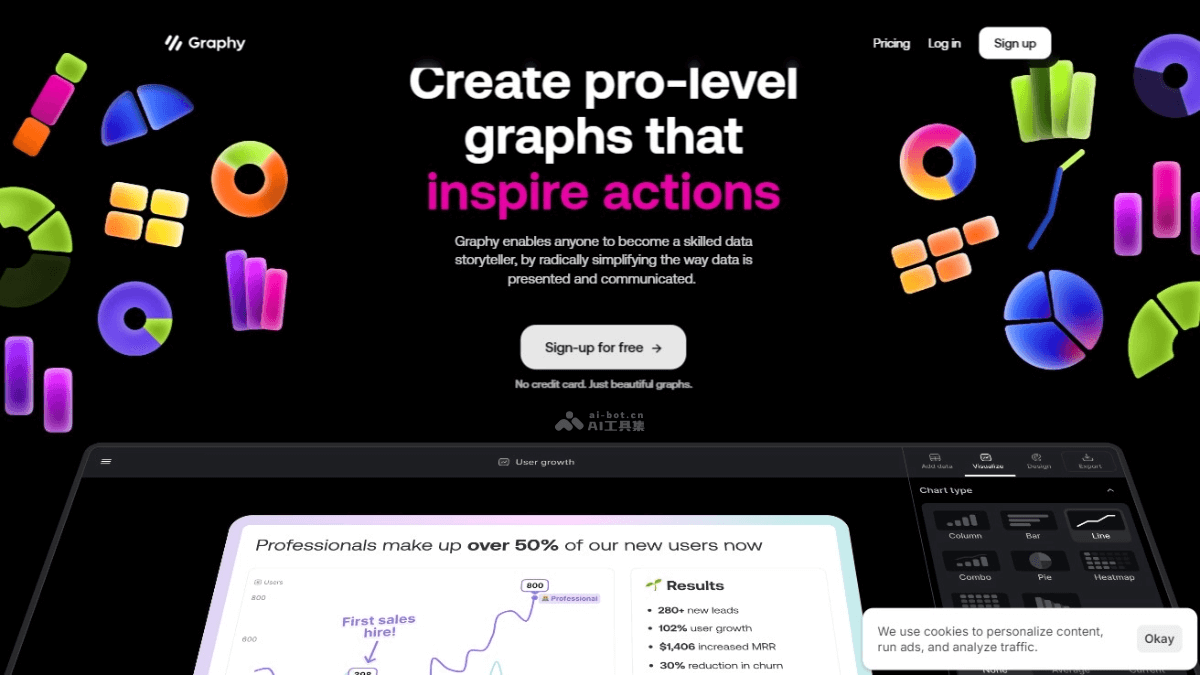
Graphy is a data visualization platform that uses artificial intelligence technology to help users transform data into visual stories. Users only need to add data, and Graphy's AI can automatically generate charts and provide key insights. These charts and insights can be integrated into presentations or shared directly to Slack. Graphy provides a rich set of visual annotation tools and one-click enhancements, such as adding target lines and trend lines, making data more vivid and easier to understand, and helping users analyze data in depth.
Product Features
- AI Automatically Generates Charts: One of Graphy's core features is its AI technology, which can automatically generate charts and provide key insights after users add data.
- Data Storytelling: Graphy provides a rich set of visual annotation tools and one-click enhancements, such as adding target lines and trend lines, making data communication more meaningful and vivid.
- Diverse Chart Types: Supports multiple chart types, such as line charts, bar charts, pie charts, radar charts, etc., to meet different needs.
- Integration with Google Sheets: Easily import and use Google Sheets data.
Product Pricing
- Free Plan:Unlimited charts; limited AI features;3 boards.
- Plus:$12 per month/user;Best for internal reporting.Includes everything in the Free plan, plus:Custom brand colors;Remove watermark;Unlimited boards;Unlimited AI features.
- Business:Includes everything in the Plus plan, plus:Dedicated support;Enhanced privacy controls;30 days of chart history.
10.Formula bot
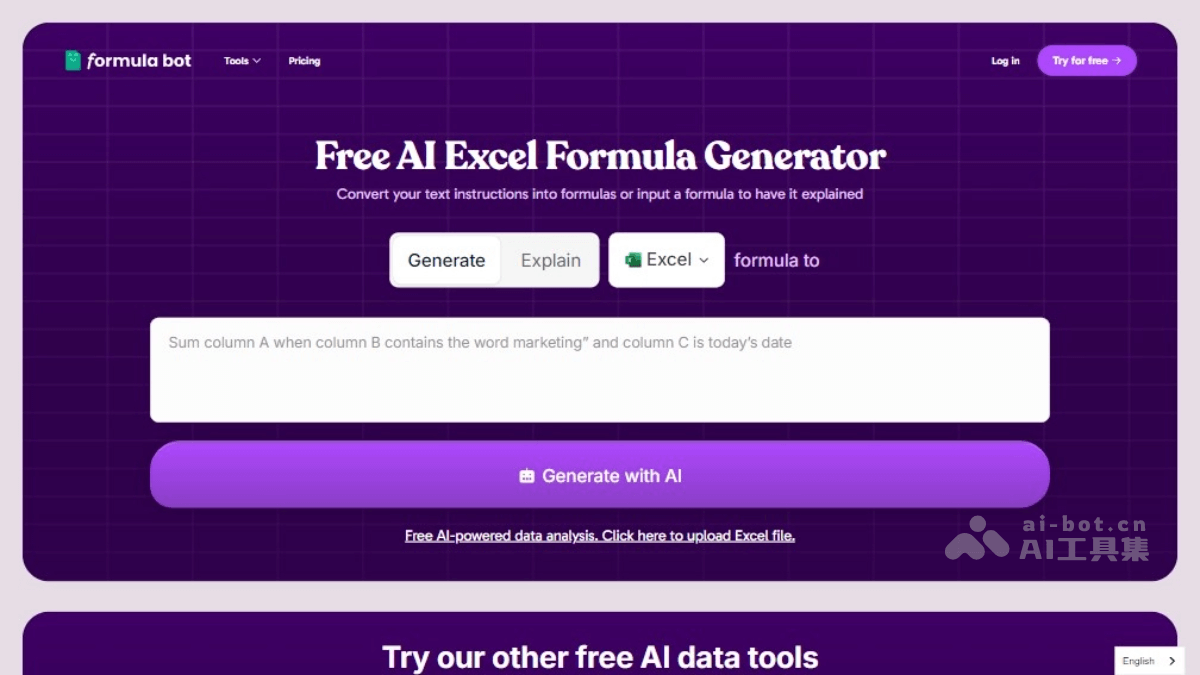
Formula bot is an AI data analysis platform that integrates data analysis, visualization, transformation, and enrichment. Through conversational interaction, users can easily generate insights, charts, and tables without programming skills. The platform supports connections to multiple data sources, provides tools such as Excel formula generation, SQL queries, and data preparation, and offers AI enhancement features such as data classification and sentiment analysis, significantly improving data processing efficiency.
Product Features
- AI-powered Excel formula generation: Formula Bot can automatically generate complex Excel formulas based on users' natural language input, simplifying the formula creation process and reducing the user learning curve.
- Data analysis: The platform supports in-depth exploration of datasets, identifies patterns and trends in data, and generates statistical reports and summaries.
- Data visualization: Formula Bot supports users in creating various types of charts and graphs, provides custom visualization effects, and generates interactive dashboards.
- Data transformation: The platform provides functions for data cleaning, preprocessing, merging, and splitting datasets, and performs complex data transformation operations.
Product Pricing
- Free plan:Free forever trial of all features;5 tool uses per month (including formula generator, spreadsheet generator, SQL, etc.);Access to Excel and Google Sheets plugins;5 chat questions per month;1 data preparation per month;1 data enrichment per month;2 files per chat.
- Basic plan: $5/month;Unlimited use of the formula generator and other tools;Access to Excel and Google Sheets plugins;10 chat questions per month;2 data preparations per month;30 data enrichments per month;2 files per chat.
- Unlimited plan: $16/month;Includes everything in the Basic plan;Unlimited chat questions;Unlimited data preparation;2000 data enrichments per month;20 files per chat;File size limit is 100MB
- Unlimited+ plan: $40/month;Includes everything in the Unlimited plan;20000 data enrichments per month;File size limit is 150MB.