
What is Graphy
Graphy is an advanceddata visualization platform, based on powerful AI technology, enabling users to turn data into visual stories. The platform simplifies the way data is presented and communicated. Users only need to add data, and Graphy's AI can automatically generate charts and provide key insights; the charts and insights can be integrated into presentations or shared directly to Slack. Graphy provides a rich set of visual annotation tools and one-click enhancements, such as adding target lines and trend lines, making data more vivid and easier to understand. It helps users analyze data in depth and effectively convey the information and stories behind the data. Graphy's design focuses on user experience, providing a simple and intuitive operation interface, so users without a professional background can quickly get started. Graphy's collaboration features support team members in sharing and collaboratively editing charts, promoting communication and decision-making among teams.
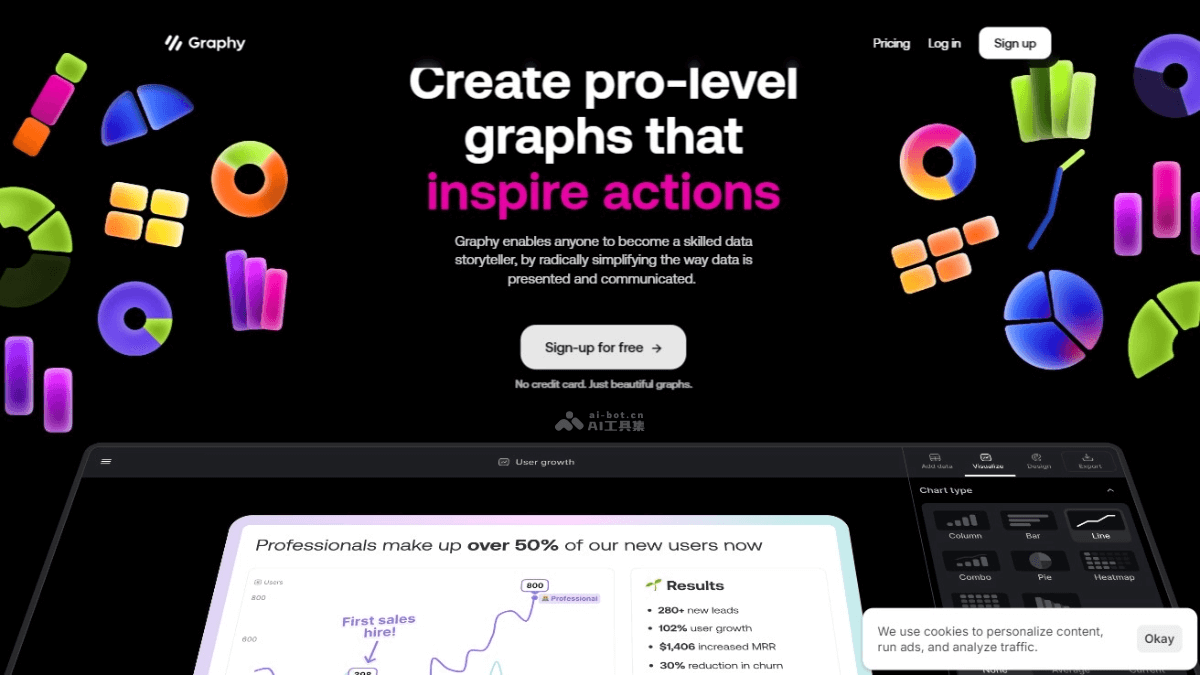
Graphy's main features
- AI automatically generates charts: Users add data, and Graphy's AI can create charts and explain key insights.
- Data storytelling: Through visual annotations and one-click enhancements, such as targets and trend lines, data communication becomes more meaningful.
- Simple and easy to use: No learning curve, the user interface is intuitive and the features are powerful.
- Integration with Google Sheets: Conveniently import and use Google Sheets data.
- API support: Allows Graphy to be integrated into other applications.
- Light/dark mode: Users choose the interface mode according to personal preference.
Graphy's product official website
- Product official website:graphy.app
Graphy's application scenarios
- Business reporting and analysis: Create charts to display key business metrics such as sales data, market share, customer growth, etc.
- Marketing: Create attractive charts and infographics for marketing materials, social media, and advertising campaigns.
- Financial reporting: Visualize financial data, such as budgets, expenses, revenue, and return on investment.
- Project management: Display project progress, resource allocation, and timelines.
- Education and academic research: Use charts in teaching and research to explain complex concepts and datasets.
- Product demonstrations: Use charts in product demonstrations and presentations to show product advantages and performance metrics.
- Internal communication: Use charts in team meetings and reports to convey key information and data-driven insights.