
What is nashnova
nashnova is an AI investment research workstation for individual investors, covering A-shares, Hong Kong stocks, and U.S. stocks, with more than twenty built-in strategies and nearly a hundred expert avatars, including the "Fu Peng Avatar" jointly released with macroeconomist Fu Peng. After a user submits a research task, it automatically completes step decomposition, data acquisition, calculation execution, and output generation, and continues running even after the page is closed. nashnova supports strategy backtesting, research report generation, industry chain decomposition, and continuous portfolio tracking. Key data can all be traced to its source, and results can be exported as PDF or turned into a shareable link.
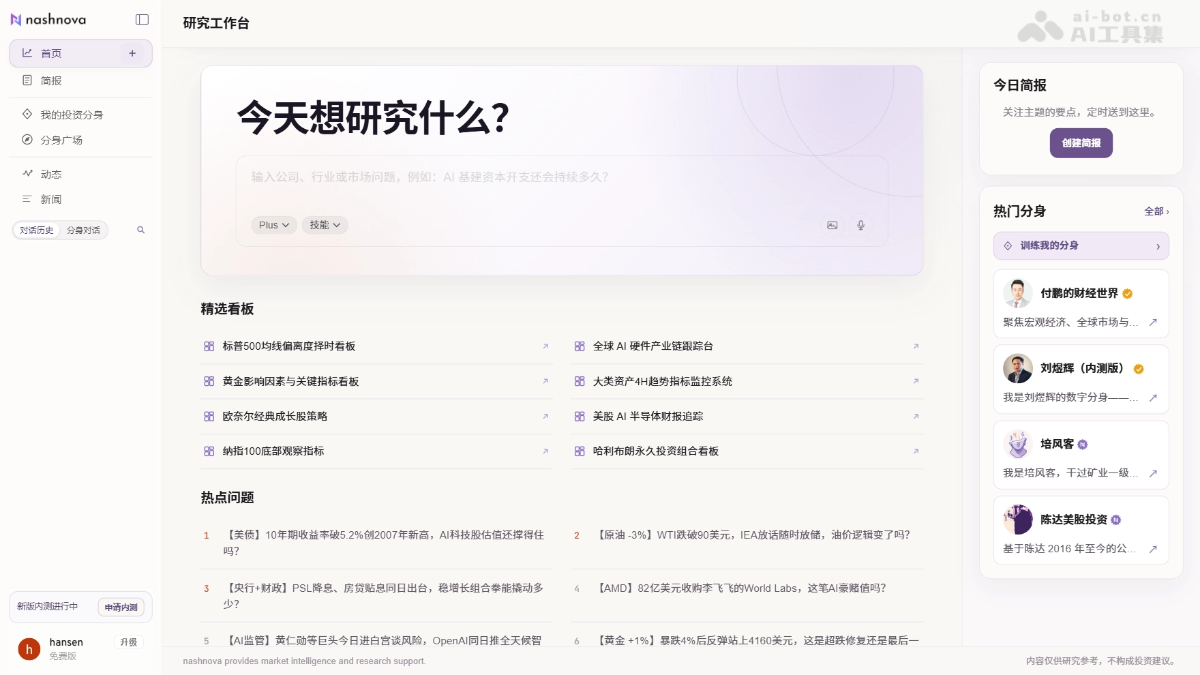
Main features of nashnova
- Built-in financial database: Preloaded with A-share, Hong Kong stock, and U.S. stock data. Asset types include stocks, ETFs, and commodities, with no need to connect a data source yourself. It covers market quotes and technical indicators, the three financial statements, earnings call transcripts, announcement events, brokerage research reports, and financial news; key figures are all labeled with source and time and can be checked item by item.
- Expert avatars: Built in with nearly a hundred expert avatars, each corresponding to a set of investment methods. When facing complex questions, you can simultaneously call on different perspectives such as macro, industry, and value to compare the key variables each one focuses on.
- Strategy backtesting: Built in with more than twenty strategies, covering technical indicators, momentum, mean reversion, grid, and event-driven approaches, and supporting backtesting for stocks, ETFs, and commodities. Hand your investment idea to the system, and it can automatically complete data retrieval, date alignment, grouped calculations, and chart generation, for example to verify whether "buy after an earnings preview exceeds expectations and hold for a certain number of trading days" is effective.
- Research report generation: Provides four types of templates: company one-pager, industry chain map, earnings review, and portfolio checkup. It automatically gathers evidence and generates reports with charts. After a new earnings report is released, research can be rerun and the parts that have changed are directly marked.
- Market pattern validation and industry chain decomposition: Hypotheses such as "whether there is excess return before an industry's earnings disclosure" can be validated against historical data, with significance and methodology notes output; it can also sort out upstream and downstream segments of an industry, representative companies, value distribution, and bottlenecks, and generate a shareable map.
- Scheduled tasks and continuous tracking: Supports daily, weekday, weekly, or one-time execution, with each task having an independent time zone. It can be used for pre-market market summaries, post-market portfolio reviews, and follow-ups on earnings and interest rate meetings. It stays silent when there is no substantive change and alerts only when a change occurs.
- Long-term memory: Holdings, watchlists, investment preferences, and past research are saved in the user's workspace and can be called across sessions. If you ask again weeks later, "How did that strategy from last time turn out?", the system can continue from the context without needing to repeat the background; small talk, guesses, and expired market quotes are not written into long-term memory.
- Custom research methods: You can save your usual research steps and judgment criteria as personal capabilities, and directly call them for similar tasks later without repeating the description.
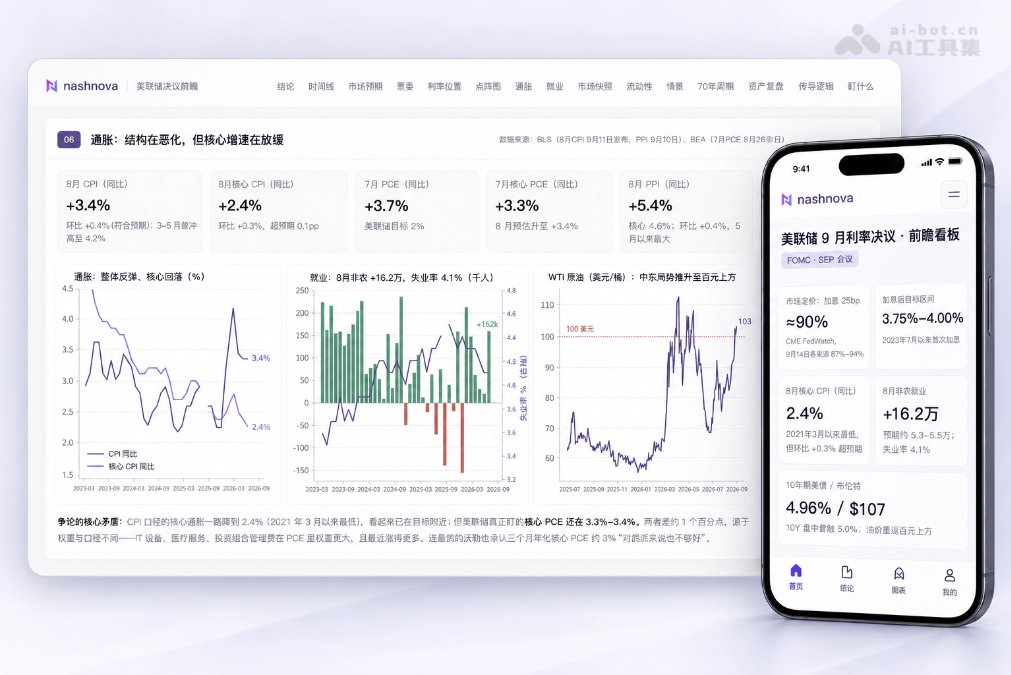
How to use nashnova
- Register and log in: Visit the nashnova official website https://www.nashnova.com/ or download the iOS/Android APP, create an account, and enter the research workstation.
- Submit a research task: Describe your research needs in natural language in the input box. The system automatically decomposes the steps and executes them, and the task continues running even after the page is closed.
- Call expert avatars: For complex questions, you can simultaneously call on personas with different perspectives such as macro, industry, and value to compare the key variables each focuses on.
- Run strategy backtests: Choose from over twenty built-in strategies; the system automatically retrieves data, aligns dates, performs grouped calculations, and generates charts to validate investment ideas.
- Generate research reports: Use four types of templates—company one-pagers, industry chain maps, earnings reviews, and portfolio health checks—to automatically gather evidence and generate reports with charts, which can be exported as PDFs or shared via links.
- Verify data sources: All key figures are labeled with their source and time; click to verify each item and ensure conclusions are traceable.
- Set scheduled tasks: Configure daily, weekday, weekly, or one-time tasks; the system only alerts you when substantive changes occur.
- Save personal capabilities: Save your habitual research steps and judgment criteria as custom methods for direct reuse in similar tasks later.
- Continue research across sessions: Holdings, watchlists, and preferences are automatically stored in long-term memory; if you ask weeks later, "How did that strategy turn out?", the system can resume the context.
nashnova's core advantages
- Full market coverage: One-stop coverage of A-shares, Hong Kong stocks, and US stocks, with asset types including stocks, ETFs, and commodities, with no need to connect data sources yourself.
- Autonomous task execution: After a research task is proposed, the system automatically breaks down the steps, retrieves data, performs calculations, and generates results; tasks continue running even after you close the page.
- Traceable data: All key figures are labeled with their source and time and can be verified item by item, making research results traceable and reusable.
- Expert persona lineup: Built-in with nearly a hundred expert personas corresponding to different investment methodologies, you can hold conversations on macro and asset allocation with the "Fu Peng persona" of the renowned economist Fu Peng.
- Cross-validation from multiple perspectives: The same question can simultaneously call on personas with different perspectives such as macro, industry, and value to compare key variables and reduce bias from a single perspective.
- Strategy backtesting out of the box: Built-in with over twenty strategies (technical indicators, momentum, mean reversion, grid, event-driven), automatically completing data retrieval, date alignment, and grouped calculations.
- Alert only on changes: Scheduled tasks remain silent when there are no substantive changes, and push alerts only when changes occur in holdings, financial reports, etc., avoiding information harassment.
Comparison of nashnova with similar competitors
| Comparison dimension | nashnova | Tonghuashun iWencai |
|---|---|---|
| Product positioning | An AI investment research workstation for individual investors, emphasizing "turning investment research methods into systems that can run" | AI investment assistant/robo-advisor, focused on one-sentence stock selection and Q&A that "hand complex investing to AI" |
| Market coverage | A-shares, Hong Kong stocks, and US stocks, including stocks, ETFs, and commodities | A-shares, Hong Kong and US stocks, indices, convertible bonds, etc., mainly focused on stock selection Q&A and market management |
| Interaction method | After a research task is proposed, the system automatically breaks down the steps, retrieves data, performs calculations, and generates results; tasks continue running after you close the page | Natural language Q&A interaction, supporting AI intelligent stock selection, photo-based stock recognition, and deep reasoning analysis |
| Strategy backtesting | Built-in more than twenty strategies (momentum, mean reversion, grid, event-driven, etc.), automatically completing data retrieval, date alignment, grouped calculations, and chart generation | Focuses on stock selection condition generation and quantitative condition screening; strategy backtesting is not a core selling point |
| Expert Avatars | Nearly one hundred avatars corresponding to different investment methodologies, including the "Fu Peng Avatar" jointly released with Fu Peng | No similar expert avatar system; services are provided in the form of a unified AI assistant |
| Continuous Tracking | Scheduled tasks (daily/weekdays/weekly); silent when there are no substantive changes, and alerts only when changes occur | Supports intelligent grouping and automatic monitoring, continuously outputting opportunity and risk alerts |
| Memory and Accumulation | Long-term memory stores holdings, watchlists, preferences, and past research, continues context across sessions, and can be consolidated into a personal research archive | Focuses on single-turn Q&A efficiency; weak in accumulating personal investment research knowledge |
| Output Deliverables | Four types of report templates (one-pager on a company, industry chain map, earnings review, portfolio checkup), which can be exported as evidence-backed PDFs or share links | Deep reasoning outputs structured investment analysis conclusions, with strong visualization and charting capabilities |
nashnova application scenarios
-
Batch screening of targets: Convert stock selection or timing criteria into executable rules, automatically run full-market scans on a regular basis, and output candidate lists with corresponding evidence, saving the time of manual searching.
-
Validate investment hypotheses: Conduct historical backtests on unverified market patterns such as "buy and hold after earnings forecasts exceed expectations" to obtain significance, applicable ranges, and failure conditions, avoiding decisions based only on impressions.
-
Deconstruct industry chains: When entering a new industry, quickly sort out upstream and downstream segments, representative companies, and value distribution, generate a shareable industry chain map, and establish an industry cognitive framework.
-
Cross-validation from multiple perspectives: For the same question, simultaneously invoke expert avatars with different methodologies such as macro, industry, and value (for example, the Fu Peng Avatar), compare key variables, and reduce judgment bias from a single perspective.
-
Continuous tracking of holdings and watchlists: Set scheduled tasks to track holdings and watched targets, and receive alerts only when substantive changes occur, solving the problem of it being difficult to keep continuous manual watch on the market.