
What is Tomoro
Tomoro is an AI-native big data analytics toollaunched by Tencent Beacon. Through a spreadsheet interface familiar to users, it breaks down the technical barriers of traditional data analytics tools, allowing anyone to easily explore the value behind tens of billions of data records. Tomoro supports seamless integration of multi-source data, can connect to business databases in real time, and can read tabular data from images. Tomoro offers upgraded classic features, such as real-time preview of column characteristics, one-click grouping and pivoting, and intelligent adaptation of functions and formulas. The operating experience is consistent with Excel and supports second-level responses on hundreds of millions of data records.
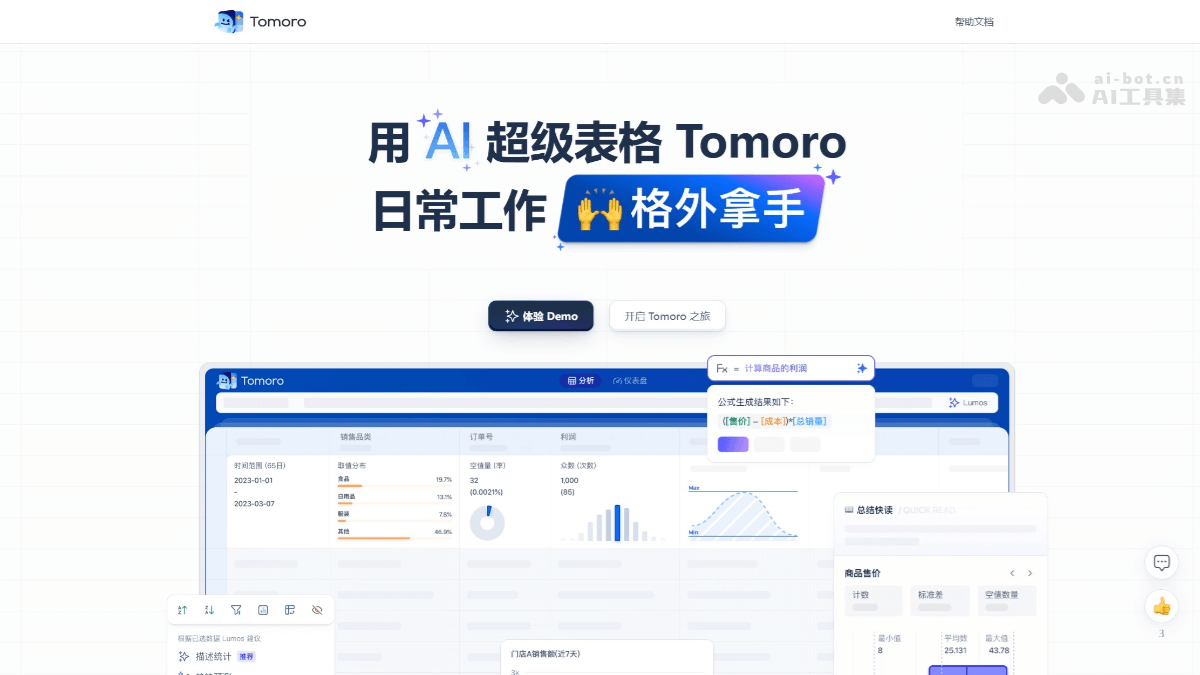
Tomoro's main features
-
Seamless integration of multi-source data: Supports real-time connection to a variety of business databases, such as MySQL and StarRocks, and can also read tabular data from images and data generated by Lumos AI, without cumbersome data downloads and format conversions, enabling cross-source data integration and analysis.
-
Upgraded classic features: Provides real-time preview of column characteristics to quickly display the core metrics of the data; supports one-click grouping and pivoting to flexibly reorganize data structures; adapts common Excel functions, so users can define the content of data columns without mastering professional query languages.
- One-click grouping: Click the column header to group by dimension, with support for multi-condition aggregate calculations; drag and drop column fields to generate pivot tables, flexibly reorganize data structures, and enable cross-dimensional analysis (such as counting/deduplicating/summing order amounts by different product categories and amounts). The operating experience is consistent with Excel but supports second-level responses on hundreds of millions of data records.
- Cross pivoting: Drag specified columns to the corresponding positions and reorganize the data content in rows and columns, making it easier to observe and understand relationships between data and improving analysis efficiency.
- Intelligent adaptation of functions and formulas: No need to master professional query languages (SQL, Python, etc.); functions and formulas make it easy to define the content of data columns. Tomoro has adapted and supports commonly used daily Excel functions, such as AND, SUM, IF, DATE, VLOOKUP, etc. In addition to continuously adding more commonly used Excel functions, it also adds Tomoro-exclusive functions tailored to everyone's business analysis scenarios.
- Analysis and intelligent questioning: Generates data summaries and exploration suggestions based on real-time data, recommends related analysis questions, and helps users clarify the direction of analysis. AI automatically completes operations such as data filtering, grouping, and sorting, returns visual results or analysis reports, and supports dynamic adjustment of algorithm parameters. It can also perform unbounded data calculations and construct rich charts based on users' specific questions.
- Intelligent chart generation:Automatically matches the best chart type and draws it; generates analysis reports with one click, covering analysis ideas, visualization charts, and conclusion descriptions.
- Data security and efficient collaboration: Provides multi-layer permission management to ensure data dissemination has boundaries; users can share data tables, charts, and analysis reports securely with team members by sharing page links, meeting permission management needs at different levels.
How to use Tomoro
- Visit the official website: Visit the Tomoro official website https://beacon.qq.com/tomoro/ to register and log in to your account.
-
Data connection: Select a data source. Tomoro supports multiple data connection methods, including local file upload, database connections (such as MySQL and StarRocks), and third-party application data import. Users can choose a suitable data source for connection according to their needs.
-
Quick browsing and filtering: View the data scale, adjust column order through column display, hide unnecessary columns, use column characteristics to understand the data characteristics of columns of interest, and quickly grasp the overall characteristics of the data.
-
Exploratory Analysis: Based on analysis requirements, perform operations such as filtering, grouping, and pivoting to obtain data analysis results. For example, you can use the filtering function to screen data under specific conditions, and use the grouping and pivoting functions to conduct multi-dimensional data analysis.
-
Visualization of Analysis Results: Generate visual charts and analysis reports to intuitively display analysis results. Users can choose appropriate chart types to display data, and can also generate analysis reports with one click, making it easy to share and use as a reference for decision-making.
Tomoro's Application Scenarios
-
Business personnel's daily data analysis: Help business personnel quickly process and analyze business data, such as sales data, customer data, etc. Through simple operations, they can obtain key business indicators and trends, supporting decision-making.
-
Data analysts' in-depth data exploration: Provide data analysts with powerful data analysis capabilities, support complex data processing and deep insights, such as data modeling, trend forecasting, etc., and improve analysis efficiency and accuracy.
-
Team collaboration and data sharing: Support data sharing and collaboration among team members, ensure data security through multi-level permission management, facilitate team members in jointly analyzing and discussing data, and promote teamwork.
-
Project management: Used for project progress tracking and resource management, helping team members understand the overall project situation, quickly discover problems and bottlenecks in the project, and improve project management efficiency.
-
Stock trend and investment analysis: Analyze stock market data, such as stock price trends, trading volume, etc., help investors make trend forecasts and investment decisions, and provide rich charts and analysis report support.