
What is Infography
Infography is anintelligent infographic generation platform, capable of transforming complex data or text content into intuitive visual presentations. It is primarily aimed at marketers, product managers, educators, and any users who need to present complex information visually. Infography's core features include automatically generating charts from text, providing a diverse selection of templates, and convenient editing tools, meeting users' needs in information presentation. Users can use it to convert complex blog articles into visually appealing infographics. Infography supports individual and team users, helping to improve information delivery effectiveness and work efficiency.
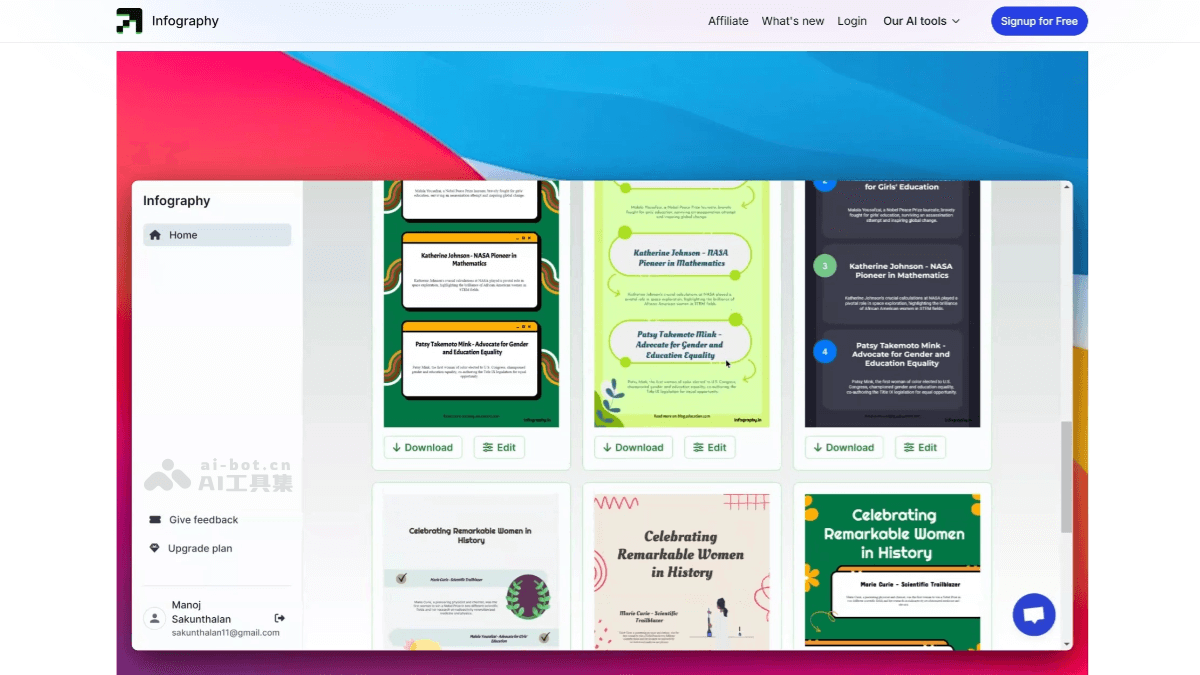
Infography's Main Features
- Automatic Text-to-Chart Conversion: Users only need to input a blog link or text content, and the AI automatically transforms this information into eye-catching infographics, simplifying information presentation.
- AI-Driven Template Recommendations: Based on the data and topic input by the user, Infography can automatically recommend the most suitable infographic templates.
- Intelligent Data Visualization: It can automatically analyze the data input by the user, select the most appropriate chart type (such as bar charts, pie charts, line charts, etc.), optimize the data presentation method, and ensure the information is clear and easy to read.
- Custom Design Tools: It provides a rich icon library, diverse font choices, and flexible color scheme adjustments, enabling users to personalize the design of infographics according to their needs.
- One-Click Chart Generation: Users only need to input key information, and the AI can quickly generate a complete infographic.
- Real-Time Preview and Editing: It supports users in adjusting and optimizing chart content and styles at any time, ensuring the final generated infographic meets expectations.
- Multi-Format Export: It supports export to common image formats (such as PNG, JPG) and vector formats (such as SVG), making it convenient for users to use on different occasions and platforms.
Infography's Official Website Address
- Official Website Address:infography.in
Infography's Application Scenarios
- Sales Reports: Clearly display sales data, performance growth trends, etc., through infographics, enabling team members and management to quickly grasp the sales situation.
- Market Analysis: Present complex market research data, consumer behavior analysis, etc., in chart form, helping decision-makers gain insight into market dynamics and formulate more effective marketing strategies.
- Course Material Creation: Create teaching content, knowledge points, case studies, etc., into infographics, helping students better understand and remember course content.
- Academic Poster Design: Used for academic conferences, seminars, and other occasions, presenting research results, experimental data, etc., in chart form to attract audience attention.
- Designing Brand Promotional Images: Present brand stories, brand concepts, product highlights, etc., in chart form, enhancing the brand's exposure and influence on social media.
- Creating Product Introduction Infographics: Publish product infographics on social media, highlighting product features, advantages, usage methods, etc., to promote product marketing.