
What is huashu-excel
huashu-excel is open-sourced by Huashu, an AI data analysis Skill. Through an eight-step process—including inspection→cleaning→alignment→analysis→reconciliation→delivery→chart verification→quality control—it solves the core problem of AI making calculation errors without reporting them during data analysis. huashu-excel uses openpyxl to read raw cells and identify structural traps, then uses the in-sheet total rows as a free checksum and reconciliation, and separately dispatches an independent agent to recalculate and challenge the results. The tool supports HTML/Excel/Word report output, depends only on openpyxl, and is open-sourced under the MIT license.
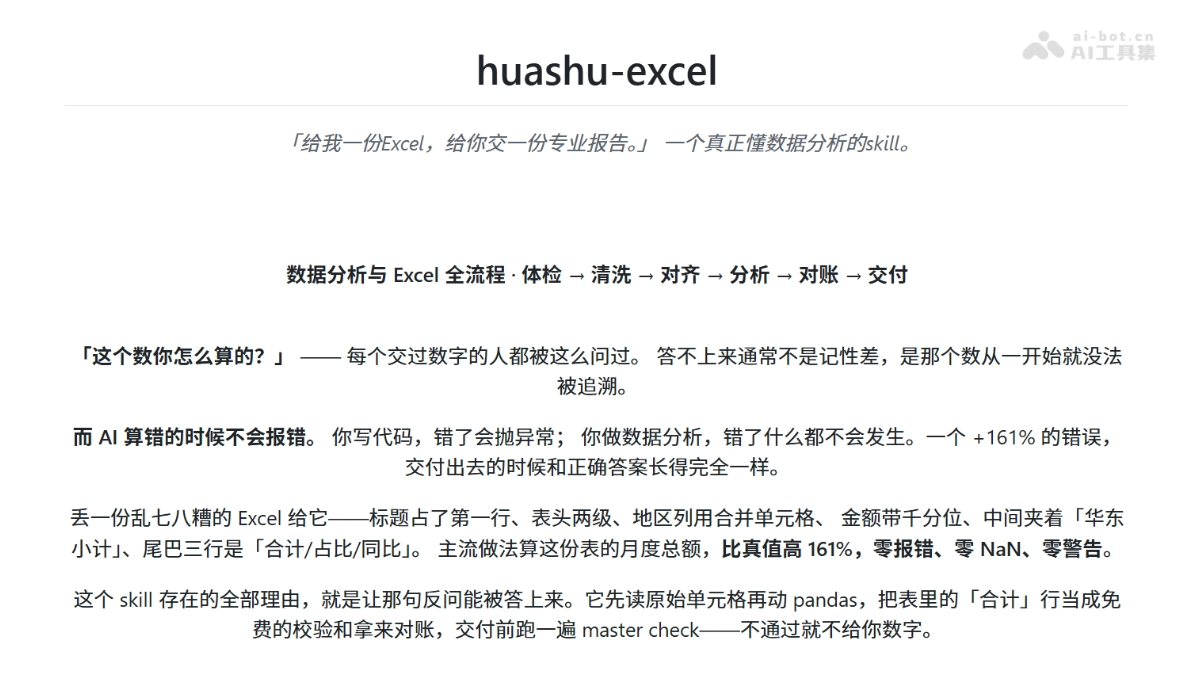
Main features of huashu-excel
-
Data inspection: Use openpyxl to read raw cells and, before pandas touches the table, first identify structural risks such as misaligned headers, merged cells, and subtotal rows mixed in.
-
Data cleaning: Convert dirty tables into standardized analysis tables and generate auditable, replayable cleaning scripts, with a record of how many rows each step affects.
-
Requirement alignment: First investigate data characteristics and external benchmarks, then confirm the real requirements and analysis definitions with the user, avoiding running a full analysis on the wrong question.
-
Data analysis: Scan for common data traps such as Simpson's paradox, ghost groups, small sample sizes, and time breakpoints, and push findings to "so what."
-
Number reconciliation: Use the cleaned details to check against the built-in "Total" rows in the sheet, using a free checksum to catch manual entry errors and definition differences.
-
Report delivery: Output self-contained HTML (inline SVG, opens offline), native Excel (charts linked to data), and Word six-page narrative reports.
-
Chart verification: Check whether SVG rendering is out of bounds, overlapping, obscured, or misleading with dual axes, ensuring charts are honest and colorblind-friendly.
-
Independent quality control: Separately dispatch an agent that did not participate in creation to recalculate from the raw data, specifically to challenge and verify the reliability of the conclusions.

Follow on WeChat and reply "open source" to join theAI open-source project exchange group
How to use huashu-excel
-
Install the Skill: Run
npx skills add alchaincyf/huashu-excelor manually clone it into the agent's skills directory. -
Choose the path: For Claude Code, put it in
~/.claude/skills/; for Codex / Kimi Code, put it in~/.agents/skills/. Project-level use can follow the repository. -
Natural language invocation: Just speak plainly, such as "Help me analyze this sales table," "Why don't these two numbers match," or "Help me clean up this table."
-
Trigger the process as needed: To ask for a single number, query directly; for a report, run all eight steps; to clean a table, run only inspection + cleaning with a replayable script attached.
-
Use scripts independently: Run directly without the agent:
profile_table.py(inspection),verify_numbers.py(reconciliation),verify_visual.py(chart verification), etc.
Core advantages of huashu-excel
-
Inspect before calculating: Use openpyxl to read the raw cell structure and, before pandas touches the table, discover risks such as merged cells and subtotal rows mixed in, avoiding misjudgment after information is damaged.
-
Total rows as checksum: Take the cleaned details and check them against the built-in "Total" row in the sheet, turning the true values calculated by the original sheet's author into a free checksum to catch manual entry errors.
-
Independent quality control sabotage: Assign another agent that did not participate in the creation to recalculate everything from the raw data, specifically to verify the reliability of the conclusions, solving the problem of "everything is correct internally but the whole is off by one fiscal year."
-
Errors trigger error reports: Through multiple gates such as row count conservation, total conservation, and cross-reconciliation, AI data analysis goes from "silent errors" to "no delivery if it doesn't reconcile."
-
Chart honesty: Select visual encodings based on the Cleveland & McGill perceptual accuracy hierarchy, reject pie charts for more than 3 categories, force bar chart axes to start at 0, and draw dashed lines for incomplete final periods.
-
Cross-agent universal: Not tied to a specific platform; can be installed on Claude Code, Cursor, Codex, OpenClaw, and Hermes, and pure standard library scripts can also run independently without an agent.
-
Minimal dependencies, works offline: The core dependency is only openpyxl; no pandas, plotting libraries, LibreOffice, or internet connection are needed. The HTML report uses hand-drawn inline SVG and can be opened directly offline.
huashu-excel project address
- GitHub repository:https://github.com/alchaincyf/huashu-excel
Comparison of huashu-excel with similar competing products
| Comparison dimension | huashu-excel | Julius AI |
|---|---|---|
| Product form | Open-source Agent Skill (MIT), can be installed on any platform such as Claude Code / Cursor / Codex | Closed-source SaaS product, web chat interface, requires account registration |
| Data reading | First use openpyxl to read raw cells for inspection, preserving merged cells, formatting, and original type information | Parse directly after file upload; merged cells are expanded and formatting information is lost |
| Error detection | The eight-step process has multiple built-in gates; no delivery if it doesn't reconcile, and errors are reported proactively | Outputs results according to the conversation flow; calculation errors usually pass silently and users must judge for themselves |
| Reconciliation mechanism | Use the cleaned details to check against the built-in "Total" row in the sheet, treating the true values calculated by the original sheet's author as a free checksum | No built-in cross-validation; total rows are treated as ordinary data rows |
| Quality control mechanism | Assign a separate independent Agent to recalculate from the raw data, specifically to challenge and verify the conclusions | Single conversation path, no independent review role |
| Chart standards | Select encodings according to the Cleveland & McGill perceptual accuracy hierarchy, force bar chart axes to start at 0, and reject pie charts for more than 3 categories | Generate charts according to instructions, with no built-in anti-misleading rules, making truncated axes and dual axes prone to appear |
| Report output | Self-contained HTML (inline SVG, openable offline), native Excel (charts linked to data), Word six-page narrative style | Charts embedded in web pages + export as static images / PDF; formatting is easily lost when forwarded offline |
| Runtime Environment | Depends only on openpyxl, can run fully offline and on an intranet, and the script can be executed independently of the Agent | Requires an internet connection, and data must be uploaded to a third-party server |
| Customizability | Open source and modifiable; SKILL.md itself is a methodology document, and the process can be adjusted as the business changes | Black-box operation; users cannot modify the underlying analysis process |
| Cost Model | Completely free, with no subscription fee and no usage limits | The free version has a quota, and the Pro version starts at $20/month |
Application scenarios of huashu-excel
-
Daily operations morning meeting review: Every day, retrieve the previous day's operational data from the backend, automatically run through inspection → cleaning → analysis → reconciliation, and before the morning meeting deliver a data fluctuation attribution report with stated definitions.
-
In-depth sales performance review: Drop in a million-row transaction detail file, automatically identify structural issues such as new products filling gaps and old products losing blood, and output an HTML report that can be presented directly to the sales VP.
-
Financial budget execution review: Analyze municipal or corporate budget tables, discover through reconciliation against external benchmarks the column-name definition trap where "everything is internally correct but the whole thing is off by one fiscal year," and provide a committee-level explanation.
-
HR compensation equity diagnosis: Process tens of thousands of compensation questionnaires, calculate the gender gap after controlling for industry/education/years of service/city, and clearly label the analytical boundaries of "what can be proven and what cannot be proven."
-
Data cleaning and audit handover: Clean dirty tables and include a replayable, auditable pandas cleaning script, with a record of how many rows each step affects, making it easy to trace responsibility or reuse later.