
What is GraphMaker
GraphMaker is anAI chart creation toolthat can understand natural language instructions and help users quickly visualize data in chart form. Users only need to upload spreadsheet data and describe the chart type or data analysis in natural language, and GraphMaker automatically generates the corresponding chart, such as bar charts, pie charts, scatter plots, and more. GraphMaker supports multiple data formats, including CSV and Excel files, and allows users to further edit and beautify the generated charts. GraphMaker emphasizes data security and promises not to store user data. The tool is especially suitable for users who need to quickly perform data visualization analysis, and is very practical in business reports, academic research, and daily data exploration.
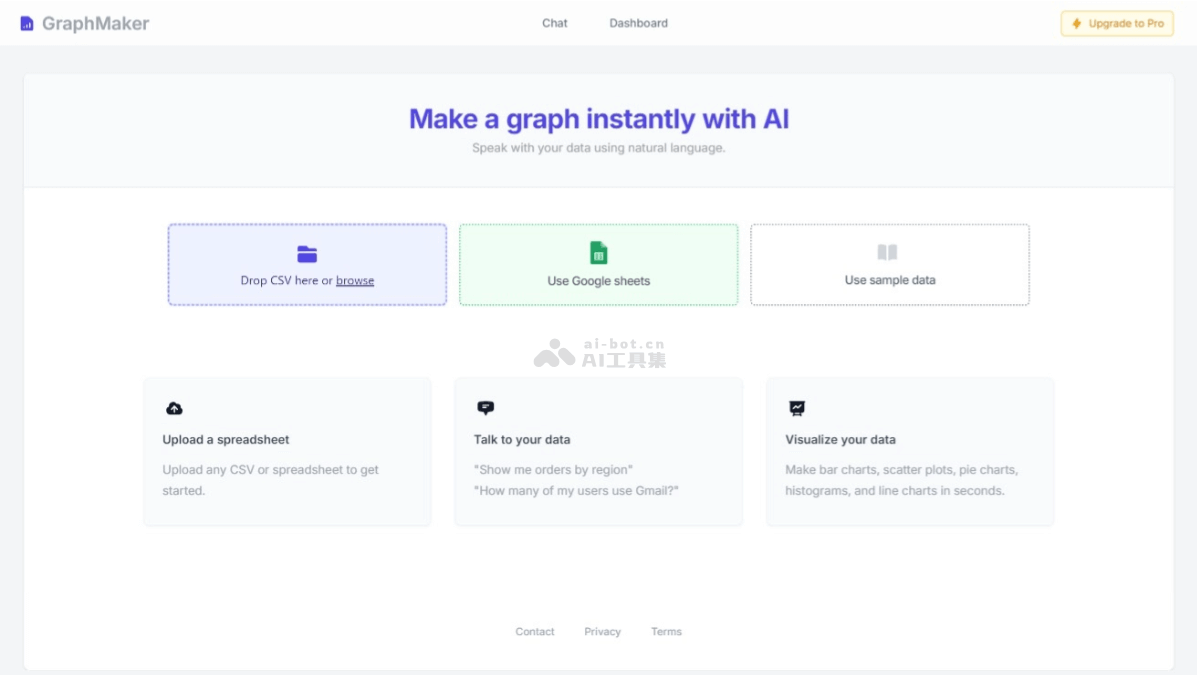
Main features of GraphMaker
- Natural language understanding: Users describe their needs in natural language, such as “show sales data by region,” and GraphMaker can understand and generate charts.
- Data upload: Supports uploading spreadsheet data in CSV or Excel format.
- Multiple chart types: Can generate multiple types of charts, including bar charts, pie charts, scatter plots, line charts, histograms, and more.
- Data visualization: Presents complex data in intuitive chart form, helping users better understand and analyze data.
- Chart editing: Users can edit after the chart is generated, including adjusting axes, modifying legends, adding labels, and more.
- Beautify charts: Provides multiple customization options, such as colors and fonts, to enhance the readability and appeal of charts.
GraphMaker's product official website
- Product official website:graphmaker.ai
GraphMaker's application scenarios
- Business reports: Enterprises use GraphMaker to quickly generate charts for sales reports, market analysis, financial statements, and more, visually presenting data to help decision-makers understand business conditions.
- Academic research: Researchers and students use GraphMaker to create charts for research data, such as experimental results and statistical analysis, supporting academic papers or reports.
- Data journalism: Journalists use GraphMaker to transform complex datasets into easy-to-understand charts, enhancing the persuasiveness and readability of news reports.
- Market analysis: Market analysts use GraphMaker to analyze consumer behavior, competitor analysis, market trends, and more, and formulate more effective market strategies.
- Project management: Project managers use GraphMaker to track project progress and display information such as resource allocation, timelines, and milestones.
- Education and training: Teachers use GraphMaker to create teaching materials, such as statistical charts and historical data, helping students better understand complex concepts.