
What is ChartinAI
ChartinAI is an AI-powered intelligent chart generation tool that helps users quickly turn natural language descriptions into professional and visually appealing data visualization charts. No programming or design skills are required—just describe it in one sentence, and multiple chart options can be generated within seconds. It supports 12 chart types, including bar charts, line charts, and pie charts, as well as 9 design styles such as minimalist and business, meeting the needs of different scenarios. ChartinAI provides multiple options for comparison, allowing users to quickly preview and choose the option they are satisfied with, and users can upload CSV/Excel files or directly paste data for personalized customization. The generated charts support high-definition export in PNG and SVG for convenient use.
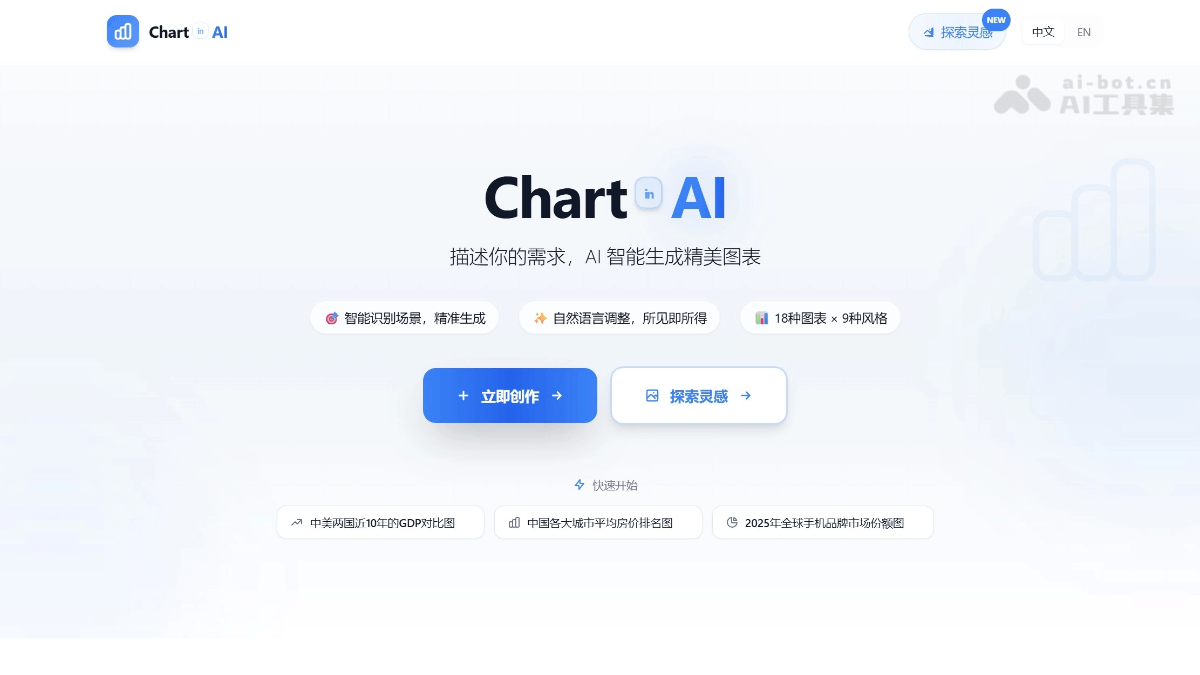
ChartinAI's main features
- AI intelligent generation: Enter a one-sentence description, and AI automatically understands the data, selects the best chart type, and generates a professional chart.
- AI automatically collects data: No need to find data yourself; AI automatically collects relevant data and generates charts.
- 12 chart types: Bar charts, line charts, pie charts, scatter plots, area charts, heatmaps, radar charts, histograms, box plots, waterfall charts, and more.
- 9 design styles: Switch with one click among multiple professional styles such as standard, minimalist, dark, business, tech, and colorful.
- Multiple options for comparison: Each generation provides multiple alternatives at the same time for quick preview and selection.
- Intelligent scenario recognition:Automatically recognizes scenarios such as finance, sales, and user analysis, and intelligently recommends chart types.
- Data file upload: Supports CSV and Excel file uploads, and you can also paste data directly.
- Multi-format export: Supports high-definition export in PNG and SVG.
- Inspiration gallery: Browse community works and modify them with one-click Fork.
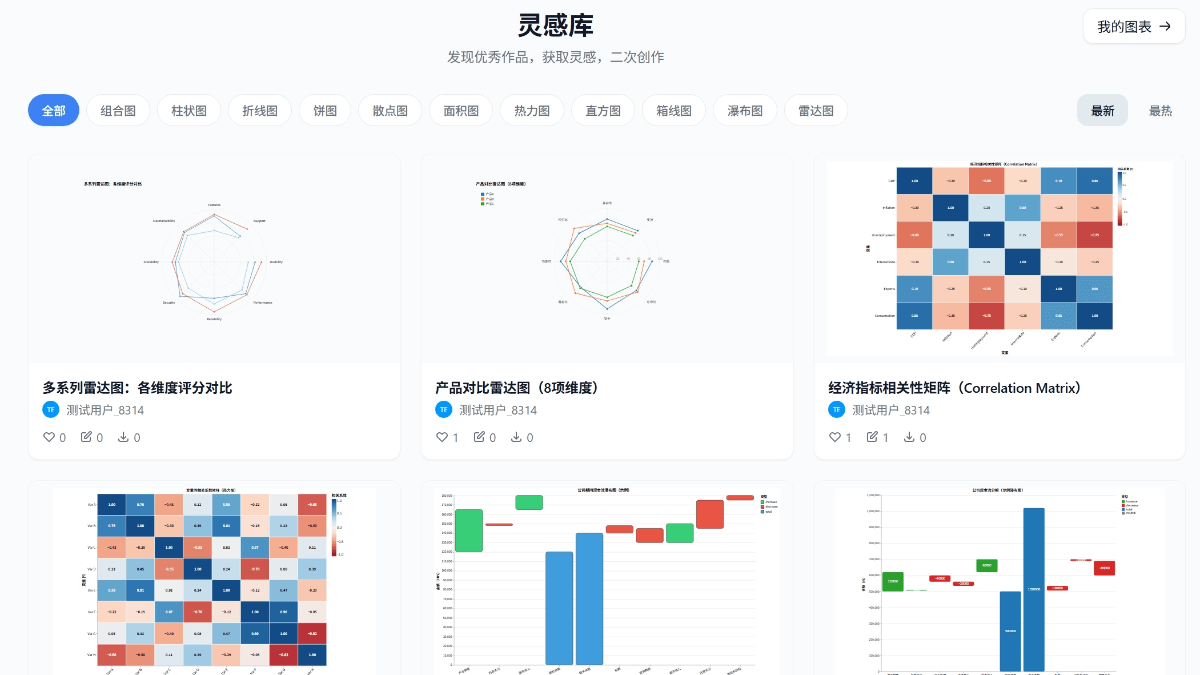
How to use ChartinAI
-
Log in to your account: Visit ChartinAI's official website https://chartinai.com , and log in with WeChat or a Google account.
-
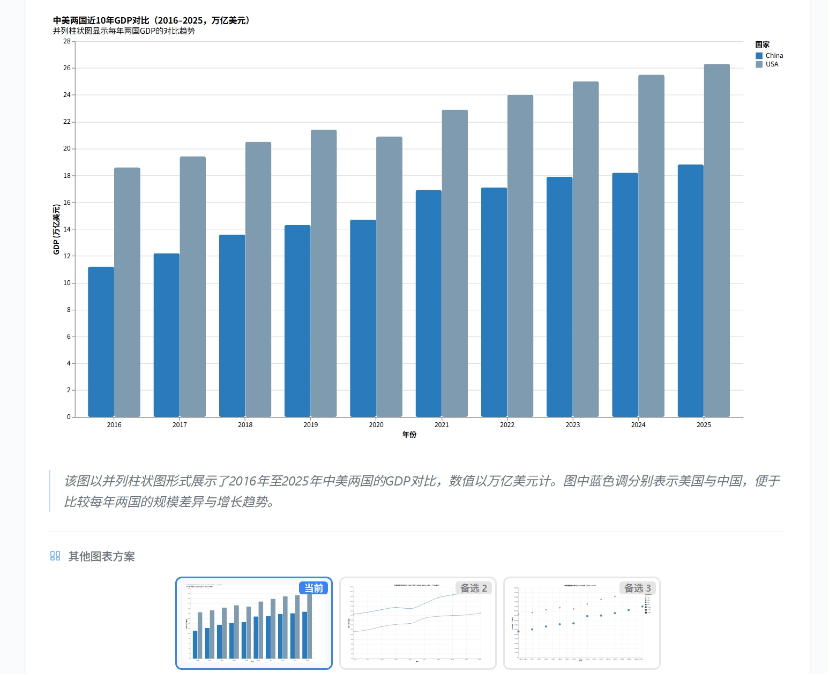
Enter your requirements: Enter a chart requirement description on the page, for example, "Comparison chart of China and U.S. GDP over the past 10 years."
-
Upload data: Optionally upload CSV or Excel files, or paste data directly, making it convenient for AI to generate accurately.
-
Click generate: Click the generate button, and AI will complete the chart and multiple alternatives within seconds.
-
Choose an option: Browse the generated chart options and choose the one you are most satisfied with.
-
Export the chart: Export the selected chart in PNG or SVG format for reports, presentations, or sharing.
ChartinAI's product pricing
- Free plan: Register to enjoy 20 generations per day and experience all features
- Monthly membership: ¥19.9/month ($2.99), unlimited generations, valid for 30 days
- Annual membership: ¥99/year ($14.99), unlimited generations, valid for 365 days, save 58%
ChartinAI's application scenarios
-
Work reports: Used to generate financial analysis charts, sales trend charts, performance comparison charts, etc., helping quickly prepare high-quality reporting materials.
-
Academic research: Assist with data visualization for papers and presentation of experimental results, enhancing the clarity and professionalism of academic expression.
-
Self-Media Creation: For creating images for public accounts and data journalism visualization, enhancing the appeal and readability of content.
-
Business Presentations: For creating PPT images and investment roadshow data presentations, enhancing the professionalism and persuasiveness of presentations.
-
Data Analysis: Help explore data patterns, conduct comparative analysis and trend insights, and assist decision-making.
-
Education and Teaching: Used for creating images for teaching courseware and presenting data cases, enriching teaching content and improving teaching effectiveness.