
What is Aitubiao
Aitubiao is an AI data visualization and analysis tool launched by Dydata Technology, focusing on providing users with convenient chart generation, data analysis, and report writing services. Aitubiao has integrated cutting-edge DeepSeek series AI models, combining powerful data processing capabilities with intelligent functions, and is committed to helping professionals efficiently process and express data, improving work efficiency and report quality.
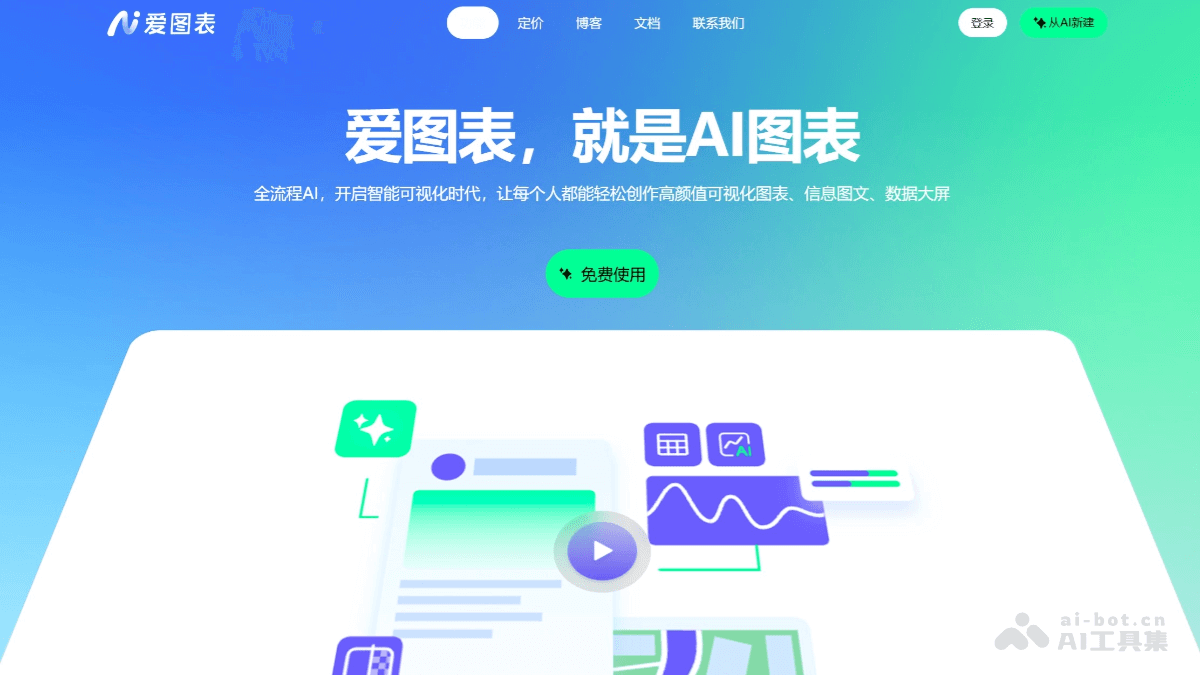
Main features of Aitubiao
- AI data charts: Intelligent file parsing, upload Excel/CSV to automatically split multiple sheets, analyze independently, automatically recommend suitable chart types based on data characteristics, and generate beautiful chart styles.
- AI data text and graphics: Supports multi-source input parsing such as text pasting/file upload/webpage link scraping, automatically summarizing the logical framework of information and structured extraction.
- Multiple chart types: Supports multiple chart types such as bar charts, line charts, pie charts, radar charts, etc., meeting different data display needs.
- Rich template styles: Provides a variety of chart templates and style options, and users can customize charts according to their needs.
- Multi-data source support: Supports importing data from multiple data sources such as Excel and CSV, and the system automatically identifies and processes data formats.
- Export in multiple formats: Supports export in multiple mainstream formats such as JPEG, PNG, and PDF, making it convenient to use in different scenarios.
- AI text generation: Integrated with DeepSeek series AI models to achieve intelligent text continuation, multilingual translation, and professional polishing.
- AI image generation: Provides unlimited generation of massive materials, combined with professional functions such as intelligent cutout and lossless enlargement, helping users process material images needed for charts.
- AI data analysis: Intelligently analyzes imported data, provides multi-dimensional analysis such as data trends, data comparisons, correlation analysis, and distribution analysis, and generates text reports.
How to use Aitubiao
-
Visit the official website: Visit the Aitubiao official website https://aitubiao.com/ , register and log in to your account.
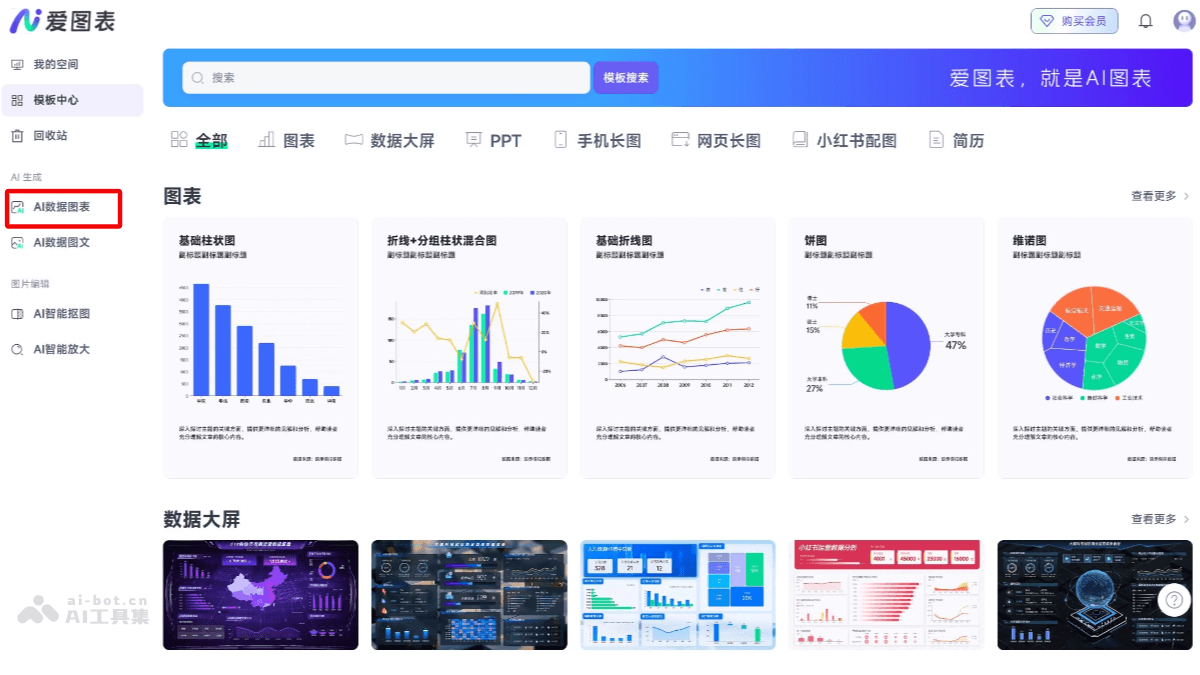
- Use AI data charts
- Import data: Import data into the platform by uploading an Excel file.
- Intelligent chart matching: Click the "AI Parse Data" button, and AI automatically analyzes data characteristics, recommends, and generates the most suitable data charts.
- Free editing and adjustment: Use the editing functions provided by the platform to personalize charts, such as real-time zooming, color matching, layout adjustment, and adding elements.
- Export and share: After completion, users can export charts and reports, or share them on the platform.
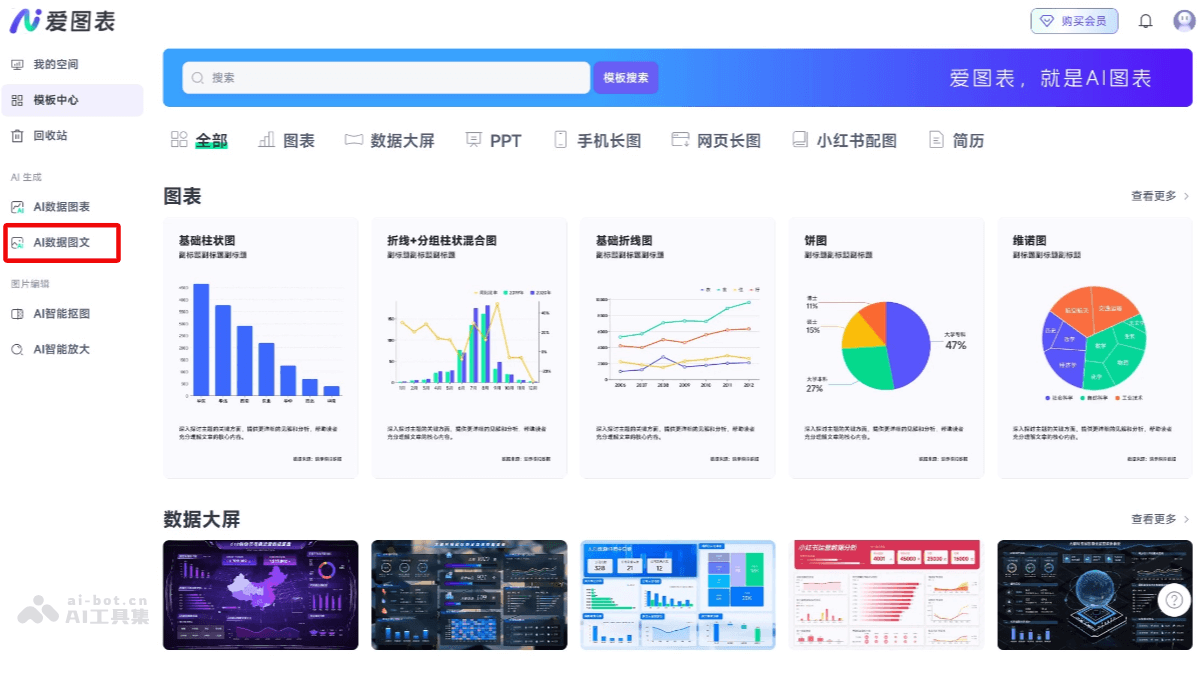
- Use AI data text and graphics
-
Create a project: On the homepage, go to [My Space]-[Create from AI-Select Data Text and Graphics].
- Choose an entry point: Choose the required operation entry point, such as clicking [Large Screen].
- Enter instructions: Enter the text and graphics instructions to be generated.
-
-
AI text generation: After entering text on the editing page, click the AI icon to continue, optimize, or translate the copy.
-
AI image generation: Enter a text description, choose a style and size, and AI generates the image assets you need.
-
Data Analysis: AI automatically analyzes data and generates interpretive text to help understand the meaning of the data.
-
Export Chart: After completing edits, choose an export format (such as JPEG, PNG, PDF, etc.) to save or share the chart.
Application Scenarios of Aituchart
-
Social Media and Content Creation: Create charts and graphic-text content suitable for sharing on social media, enhancing visual appeal.
-
Academic Research and Paper Writing: Help researchers and students turn complex data into intuitive charts, assisting academic expression.
-
Data Dashboards and Real-Time Monitoring: Create data dashboards, suitable for real-time monitoring and displaying key metrics, facilitating decision-making.
-
Education and Training: Used to create teaching courseware and training materials, making data presentation more vivid and easy to understand.
-
Personal Projects and Creative Design: Support personal creative projects, quickly generate charts and design elements, and improve creative efficiency.