
What is AiBiao
AiBiao (formerly VisDoc) is an AI text-to-chart tool that, based on natural language processing (NLP) technology, quickly converts text content into intuitive charts and supports generating bar charts, line charts, pie charts, and many other types. AiBiao has a simple interface and is easy to operate, making it suitable for beginners to get started quickly. AiBiao's intelligent text analysis function supports automatically identifying key information in text and generating charts that meet user needs. AiBiao provides rich customization options and multiple output formats, applicable to many fields such as data analysis, report writing, business presentations, and education, and can effectively improve the efficiency and effectiveness of information communication.
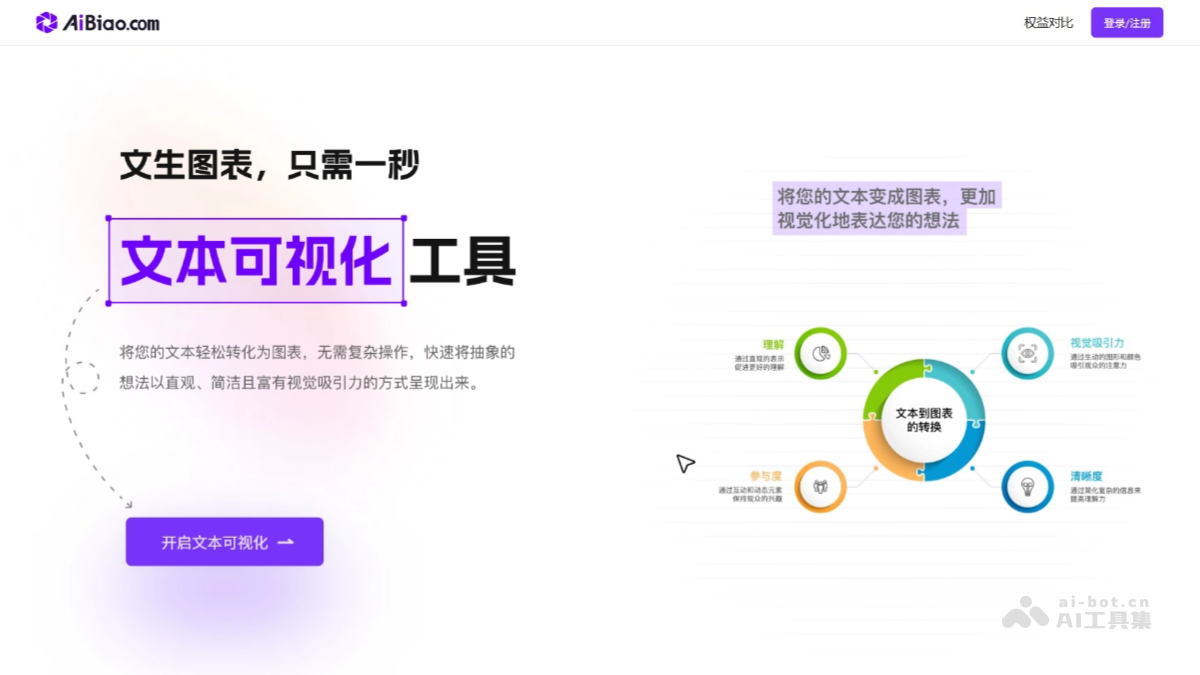
AiBiao's main features
- Quickly generate charts: Users input text content, and key information in the text (such as values, dates, categories, etc.) is quickly analyzed and converted into intuitive charts.
- Diversified chart types: Supports a variety of common chart types, including bar charts, line charts, and pie charts.
- Customize chart styles: Users can adjust chart colors, titles, legends, and other styles, support dynamic adjustments, and view modification effects in real time.
- Supports multiple output formats: Supports images in multiple output formats such as PNG, SVG, and PDF.
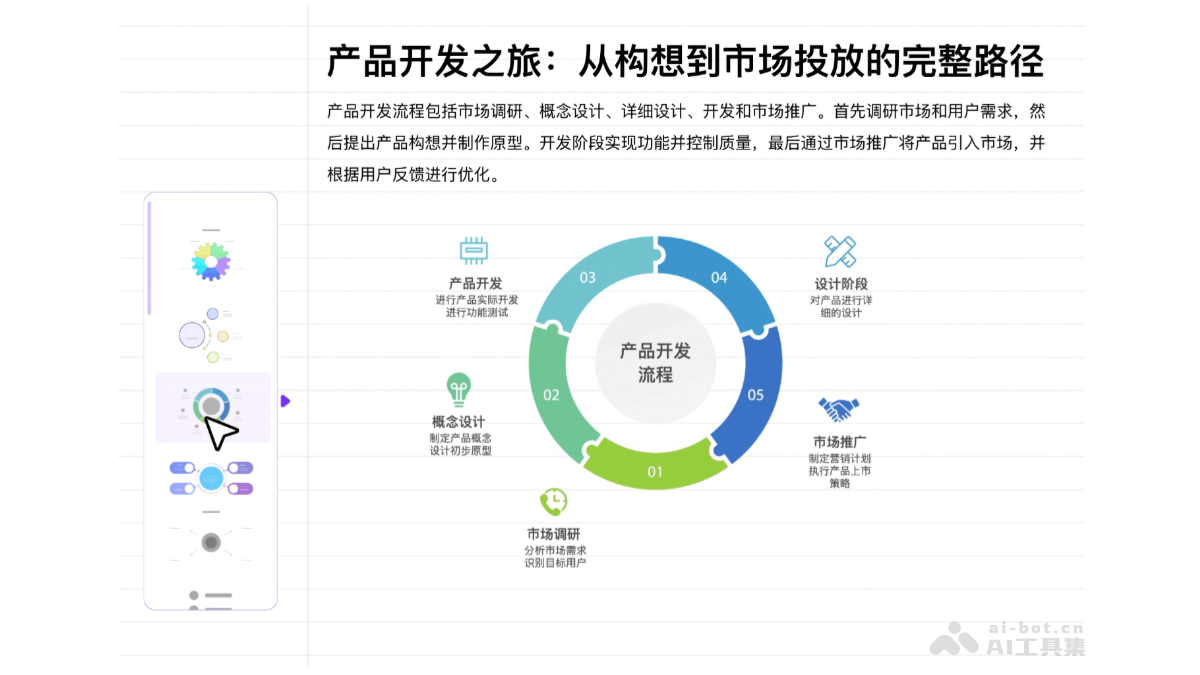
How to use AiBiao
- Register and log in: Visit the AiBiao official website aibiao.com to complete registration and login.
- Input text content: In the text input box, enter the text content you want to visualize. The content includes data analysis reports, market research results, experimental data, etc. As long as it contains enough information (such as values, dates, categories, etc.), AiBiao can generate the corresponding charts.
- Select chart type: After entering the text, click the "magic wand" and the system will automatically analyze the text content and prompt you to choose an appropriate chart type.
- Adjust chart styles: After generating the chart, adjust the chart style according to your needs.
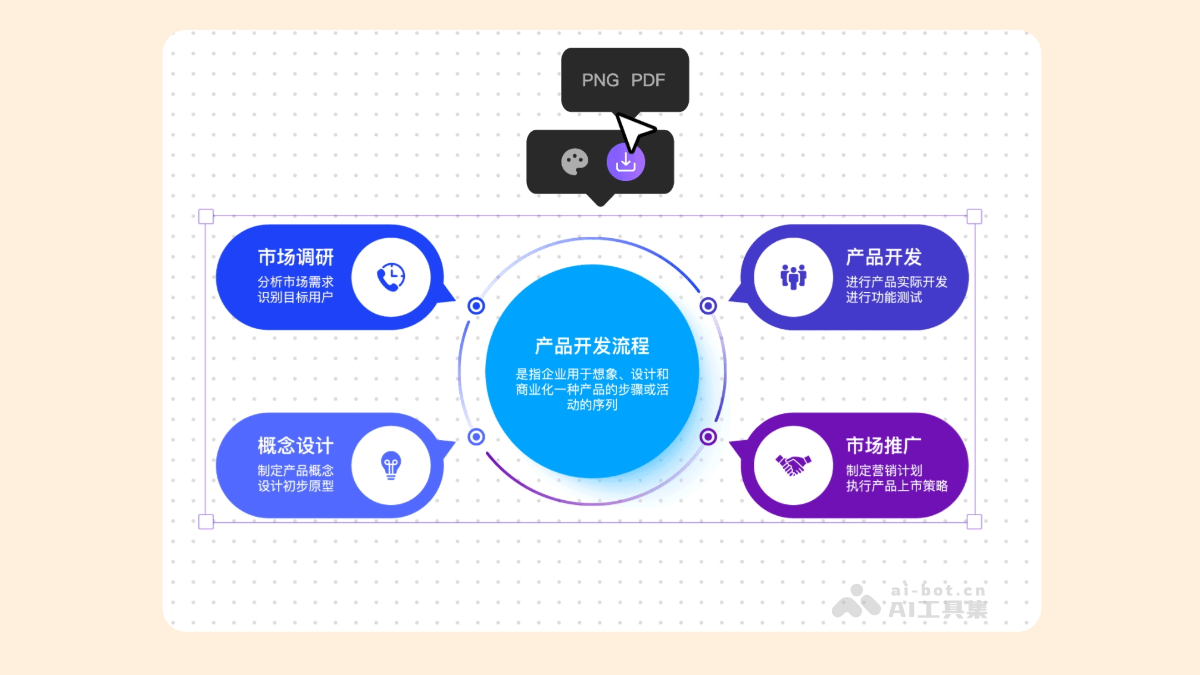
- Export chart: After completing the generation and adjustment of the chart, choose to save or share the chart, and select the appropriate format for saving as needed.
AiBiao product pricing
- Lifetime VIP:¥199
- 1-year VIP:¥69
- 1-month VIP:¥9.9
Membership benefits: Unlimited chart generation per day, free use of massive charts, PNG format downloads, PDF format downloads, personal commercial authorization, watermark-free online editing and export, and dedicated customer service.
AiBiao application scenarios
- Data analysis: Helps data analysts quickly convert complex data (such as market research data, financial statement data, user behavior data, etc.) into intuitive charts, and quickly understand the distribution, trends, and relationships of the data.
- Report writing: Converts complex text content into charts, making reports more intuitive and easier to read, and improving the professionalism and readability of reports.
- Business presentations: In business presentations, present key information in chart form to enhance the effect and persuasiveness of the presentation.
- Education field: Helps teachers present complex knowledge points in chart form, helping students better understand and remember.
- Personal projects: Suitable for personal projects, creative showcases, or blog content creation, quickly generate charts to enhance the visual effect of the content.