
Fellow e-commerce operators and sellers, who in e-commerce today hasn't been tormented by order analysis, data reports, daily and weekly reports, and anomaly alerts? In the past, doing data analysis meant staying up late digging through Excel, writing formulas, making pivot tables, and organizing charts. You couldn't get anything out for at least half a day, and beginners had no idea where to start.
Now with Singclaw, ordinary people can handle the entire e-commerce analysis workflow without code, and efficiency is maxed out instantly!
In today's tutorial, we'll teach you step by step how to use Singclaw to turn messy order, product, user, and ad placement data into clear reports, precise insights, and actionable strategies with one click, saying goodbye to inefficient overtime from now on.
1. First, get to know: What is Singclaw?
Singclaw is a desktop AI agent with memory capabilities, built specifically for high-frequency data scenarios such as e-commerce. No SQL, no complex configuration. Through natural language conversation, it can complete the full closed loop from data import → cleaning → analysis → reporting → automatic push. It specifically solves the most headache-inducing problems for e-commerce people: repetitive reports, data anomaly troubleshooting, and business diagnostics.
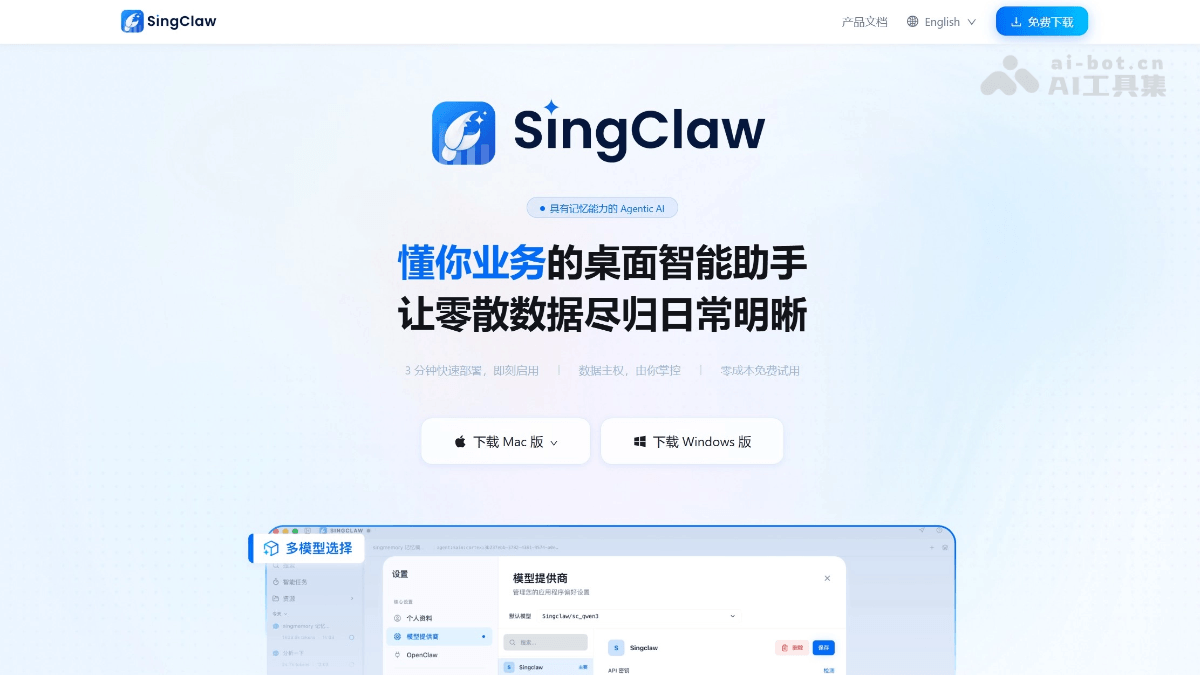
Whether you are a Taobao/Tmall/Douyin/Amazon/Shopify seller, or brand operations, data analyst, or even a small-team individual seller, you can get started quickly and spend time on product selection, operations, and growth, instead of being stuck in spreadsheets.
Official website address:https://www.singclaw.ai/
Supports Mac/Windows dual-platform downloads, free to start, and can be used online in 3 minutes.
2. Zero foundation introduction: 3 steps to import data and start analysis
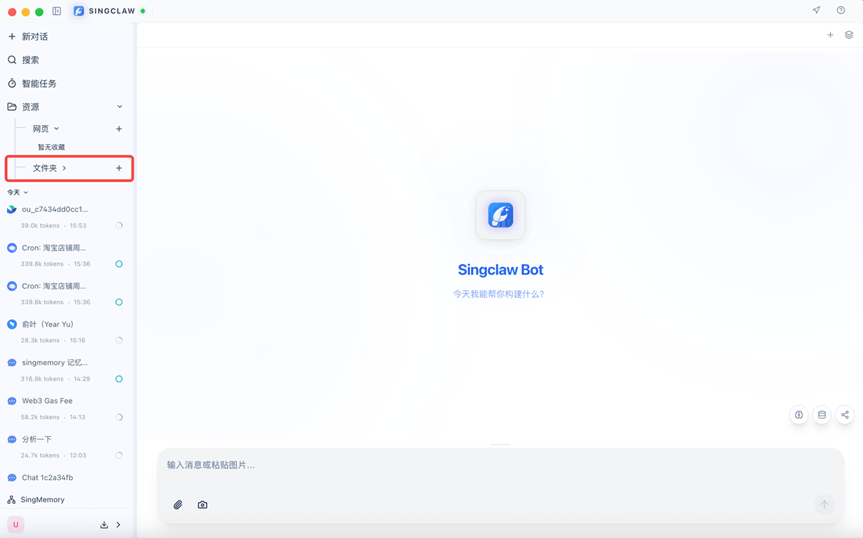
Step 1: Open Singclaw, find the folder, and click the "+" sign
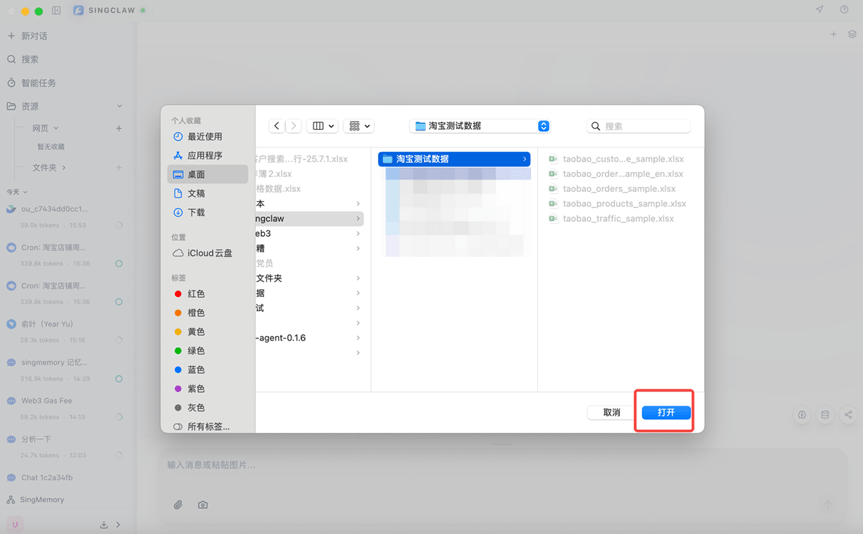
Step 2: Select your order table/product table/user table, and click "Open"
Step 3: Select the file you just imported and start analyzing directly
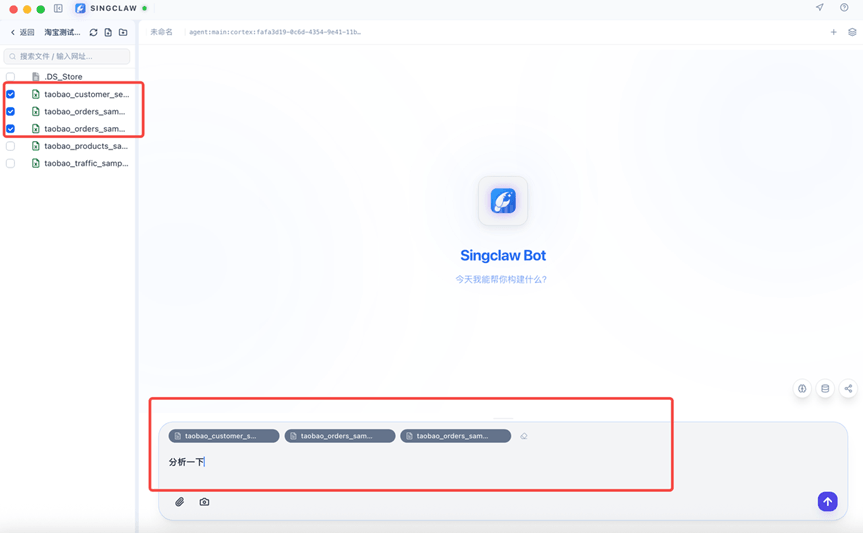
The tool automatically recognizes fields: order number, amount, time, product name, status, etc. You don't need to label them manually. Data reading is completed in seconds.
3. Core process: 7 steps to complete the entire e-commerce data analysis chain
1. Data understanding and exploration
Data recognition: automatically distinguish text, numeric, date, and amount fields
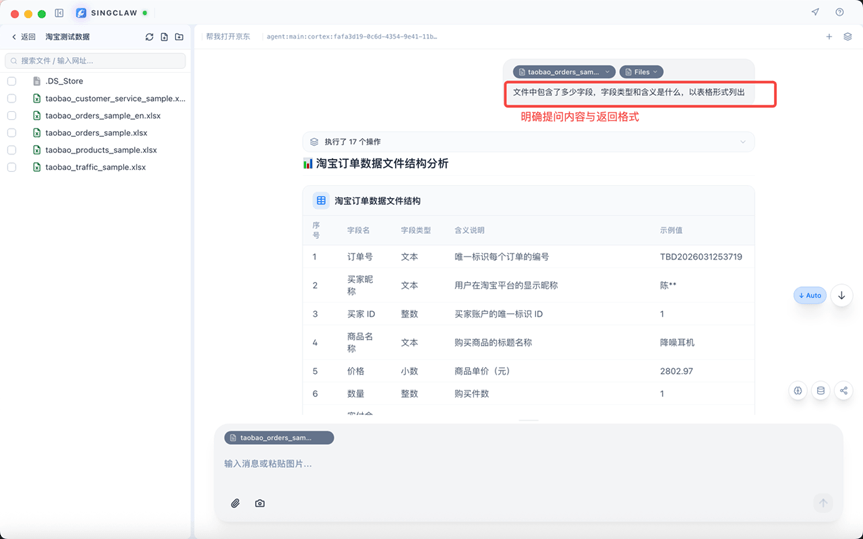
Data statistics: one-click overview generation — order volume, GMV, user count, average price, refund rate, etc.
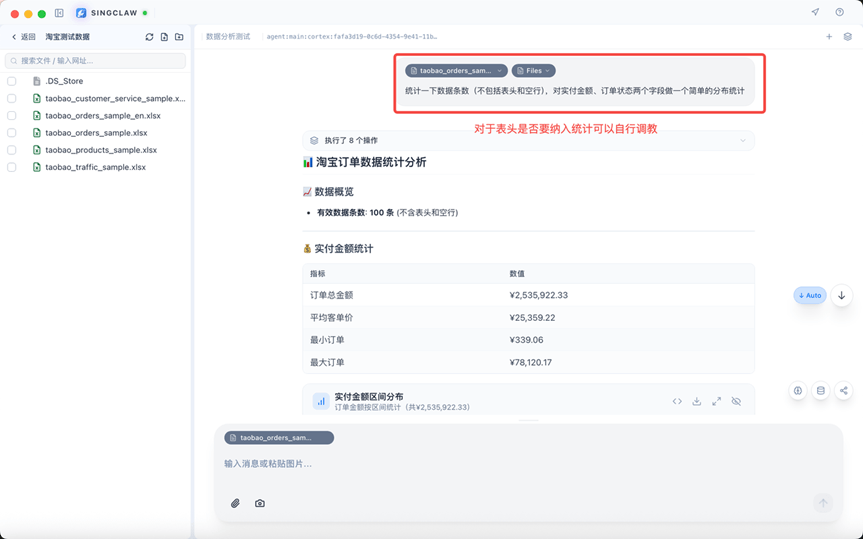
2. Data quality check (super worry-free)
Automatically detect null values, outliers, and duplicates, with highlighted annotations
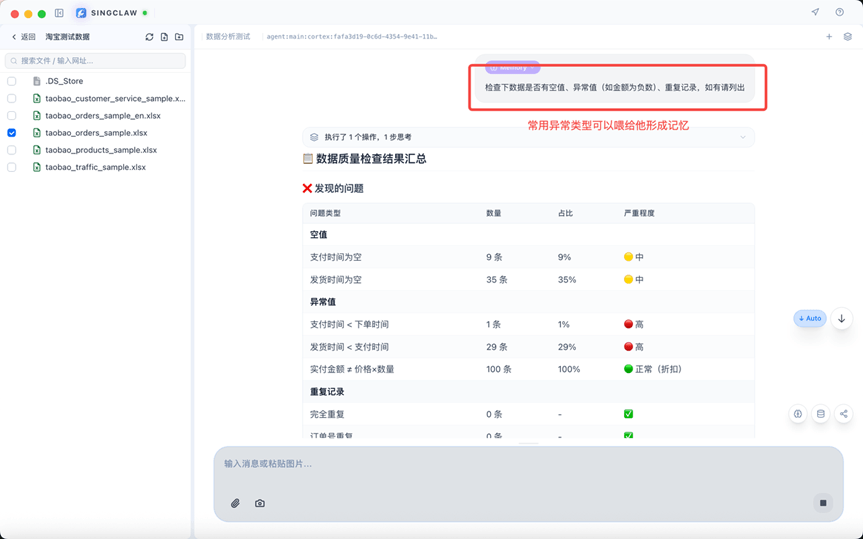
Intelligently validate data reasonableness: for example, negative amounts, abnormal times, contradictory statuses, etc.
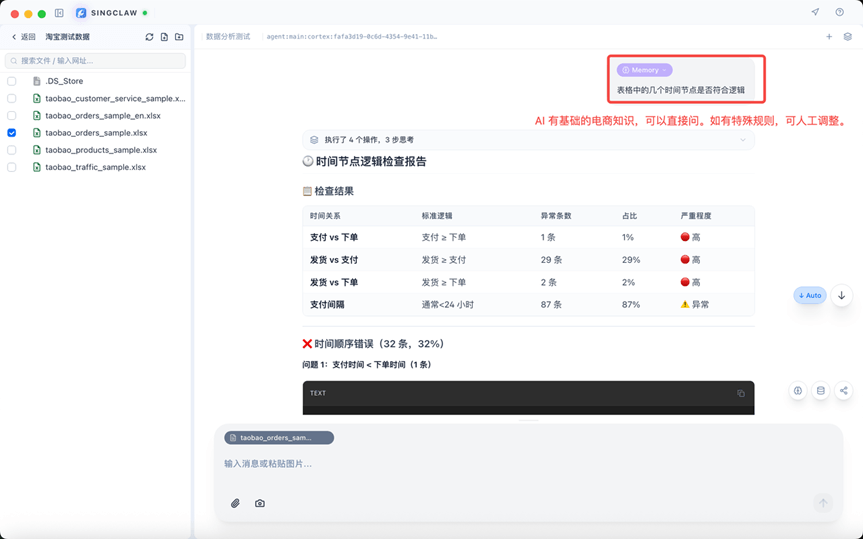
3. Data cleaning and preprocessing
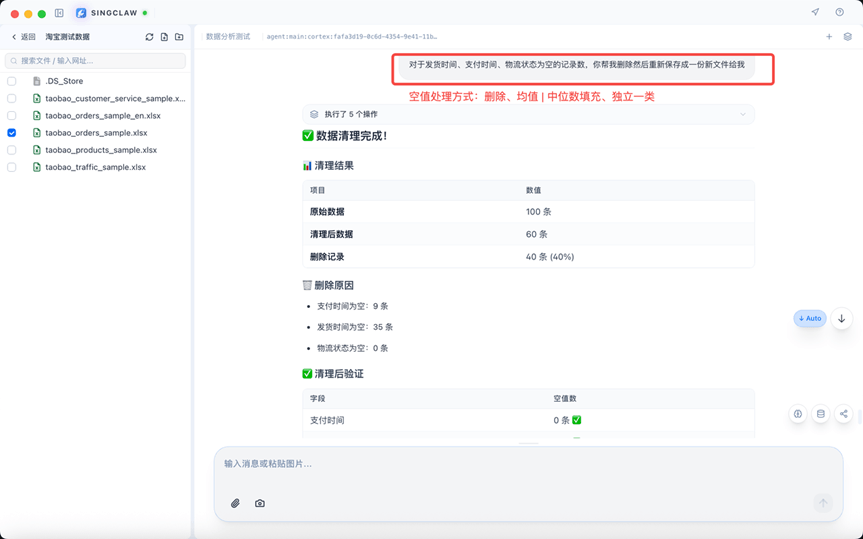
Intelligent null value filling: mean/median/delete, done in one sentence
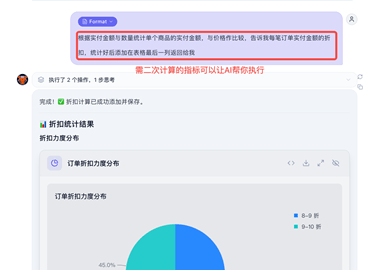
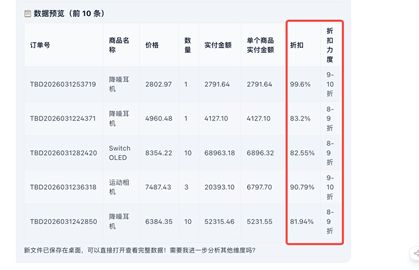
Quickly add new fields: discount rate, average order value, profit margin, month/week dimensions
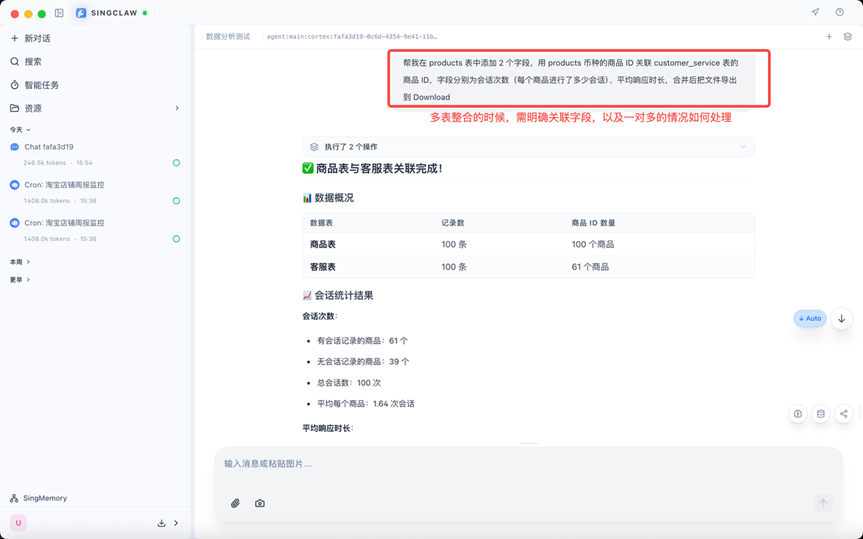
Multi-table integration: order table + user table + product table, automatically merged by ID
4. Four-layer data analysis (truly helps you make decisions)
Singclaw's most powerful aspect is not just "looking at numbers," but a four-layer analysis closed loop:
Descriptive analysis: What happened? (GMV, orders, conversion rate, refund rate)
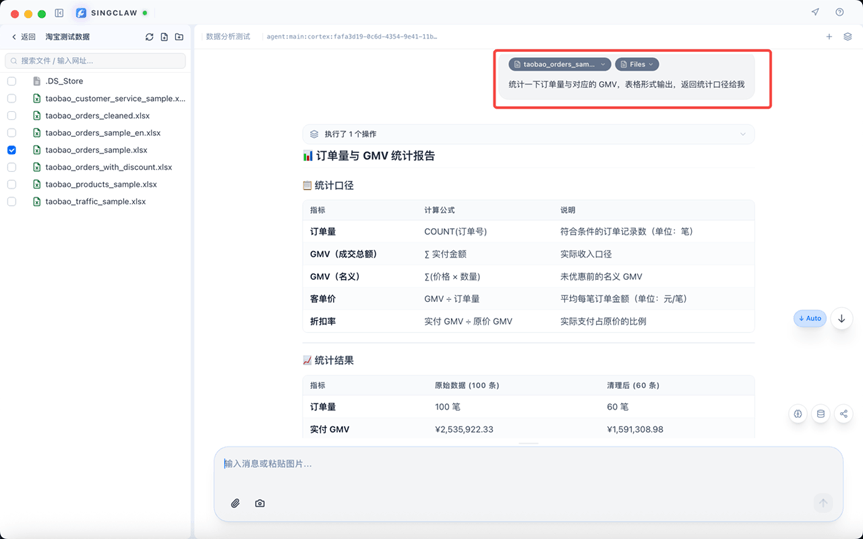
Diagnostic analysis: Why did it happen? (Traffic decline? Low conversion? High refunds? Competitor influence?)
Predictive analysis: What will happen? (Predict next week's/next month's performance based on trends)
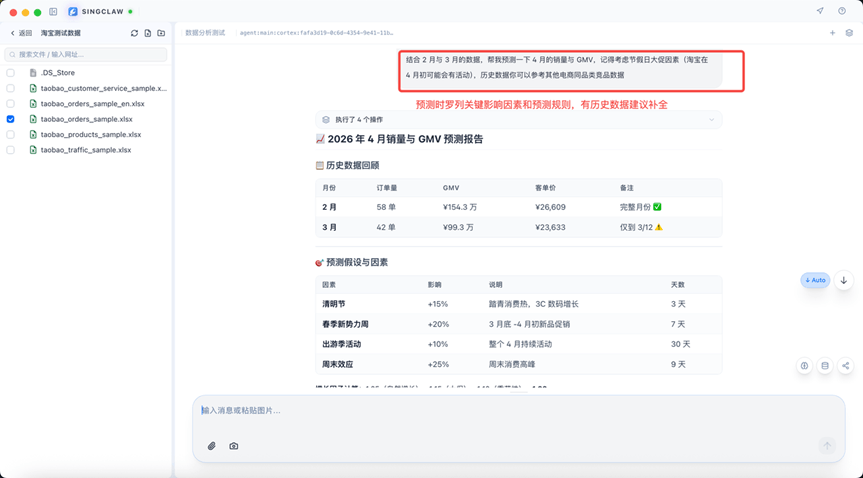
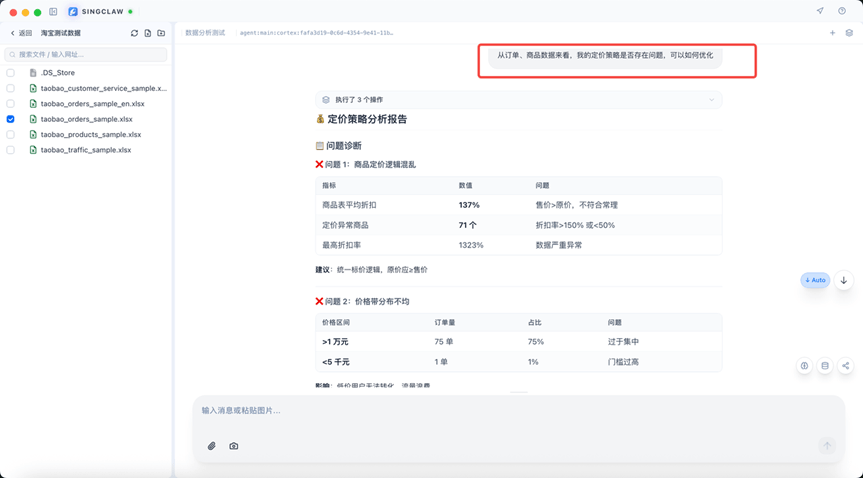
Strategic analysis: What should be done? (Directly provide campaign, pricing adjustment, traffic acquisition, and optimization suggestions)
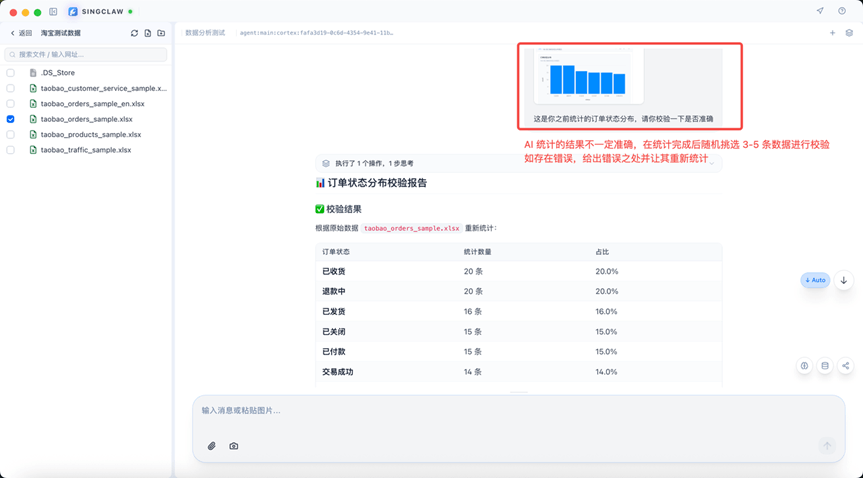
5. Result verification
No matter how smart AI is, you still need to verify! Singclaw supports consistency validation: cross-checking statistical definitions, time ranges, field logic, and summary values to ensure reports are reliable and don't fail.
6. Automated reporting/monitoring (automatically receive reports every morning)
Feishu bot setup steps
- Create a Feishu group
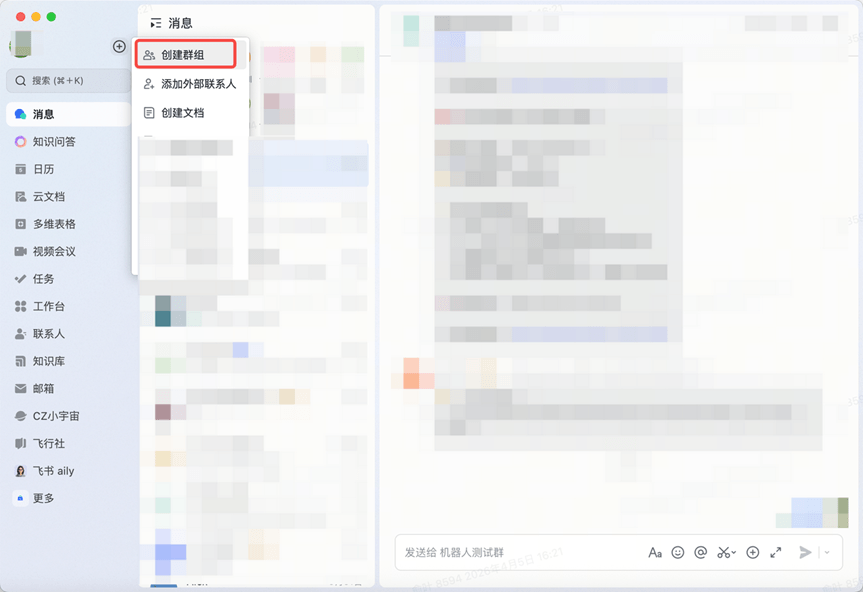
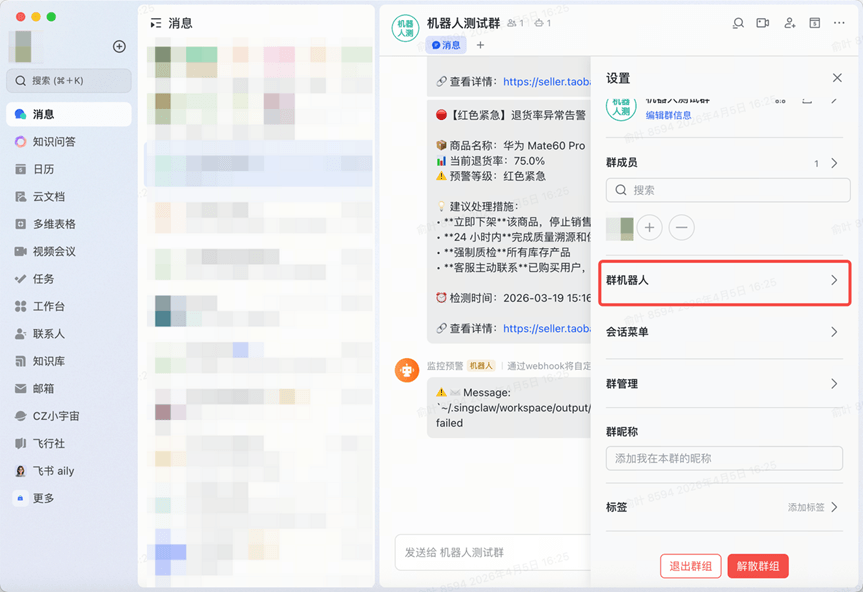
- Open group settings → select Bots
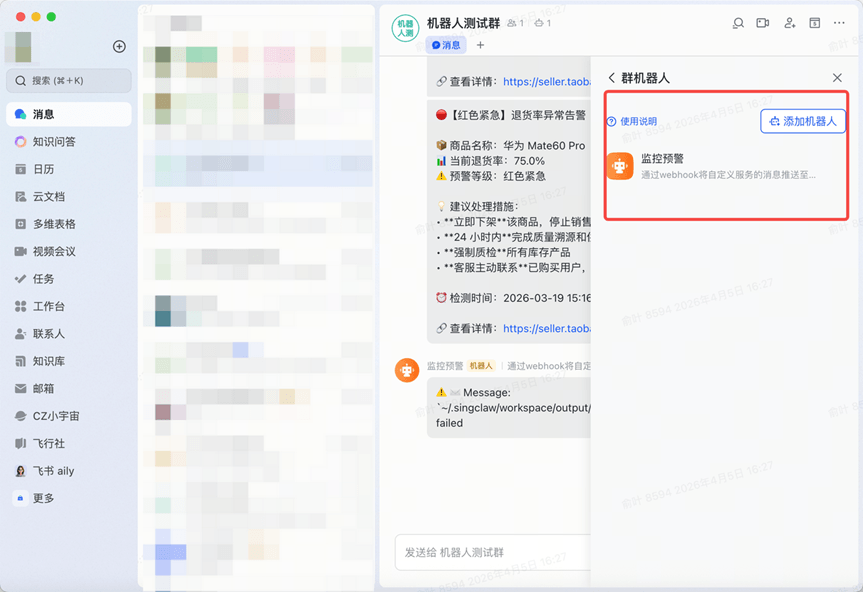
- Add the Singclaw bot
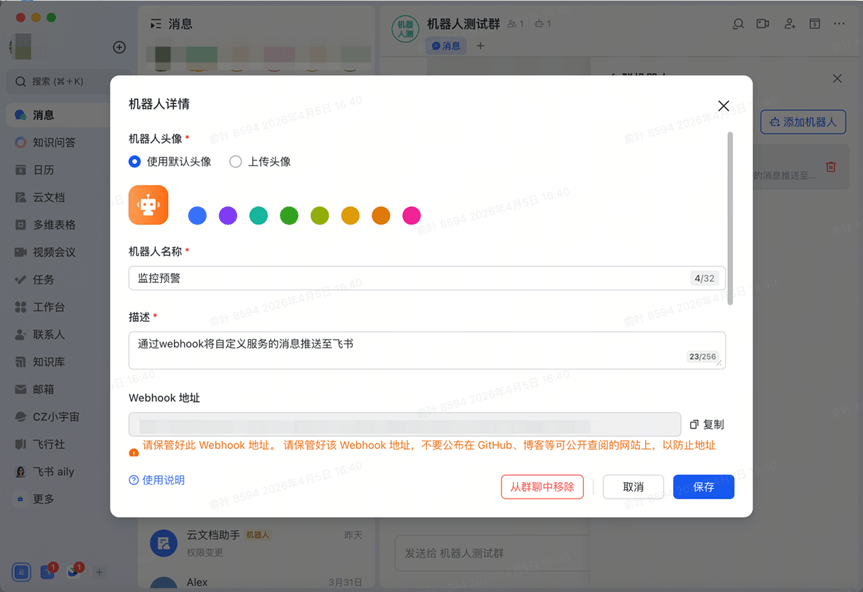
- Copy the webhook url and bind it
Scheduled task setup
- Set automatic push every day at 9 AM
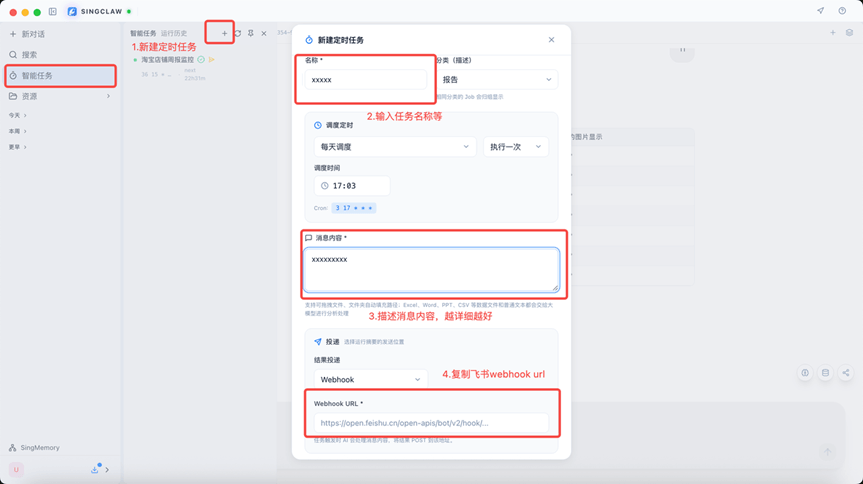
- Output yesterday's core metrics: GMV, orders, conversion rate, refund rate, TOP products, anomaly alerts
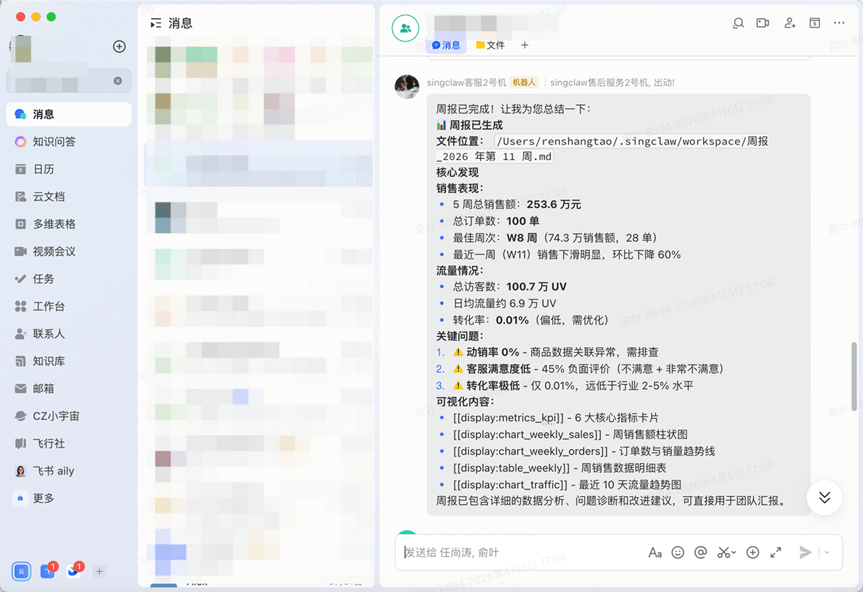
See conclusions directly in the team group, no need to manually create daily reports anymore
7. Predefined report templates (configure once, reuse forever)
Customize analysis Skills and save your analysis logic as templates, such as: classic order data analysis template, monthly business review template
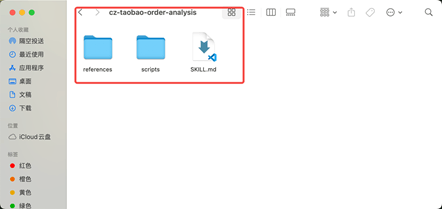
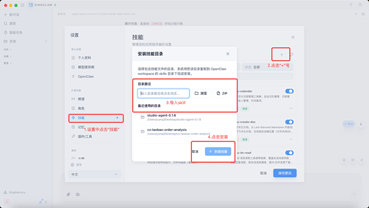
Import new data to invoke the template, and a complete report comes out in seconds, one step ahead of others and ready for meetings
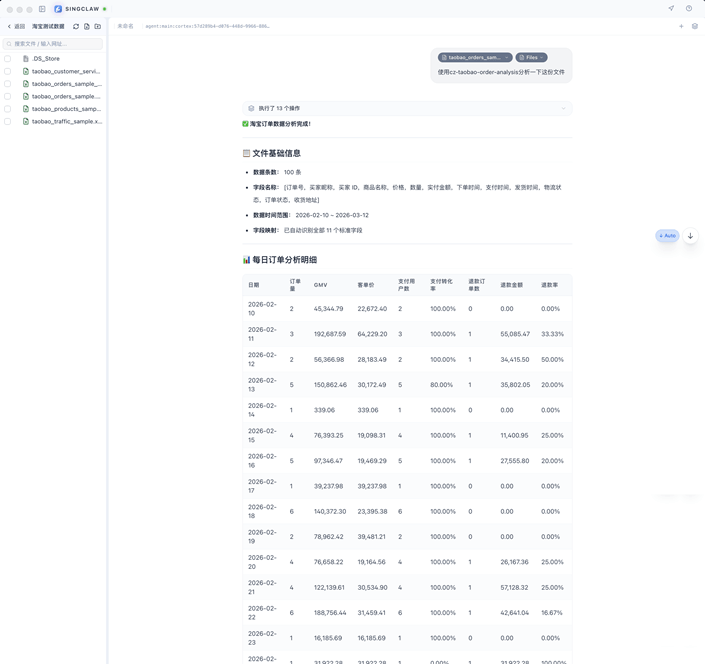
4. Real scenario demonstration: an order data analysis case
Taking Taobao order data as an example, time range 2026-02-10 to 2026-03-12:
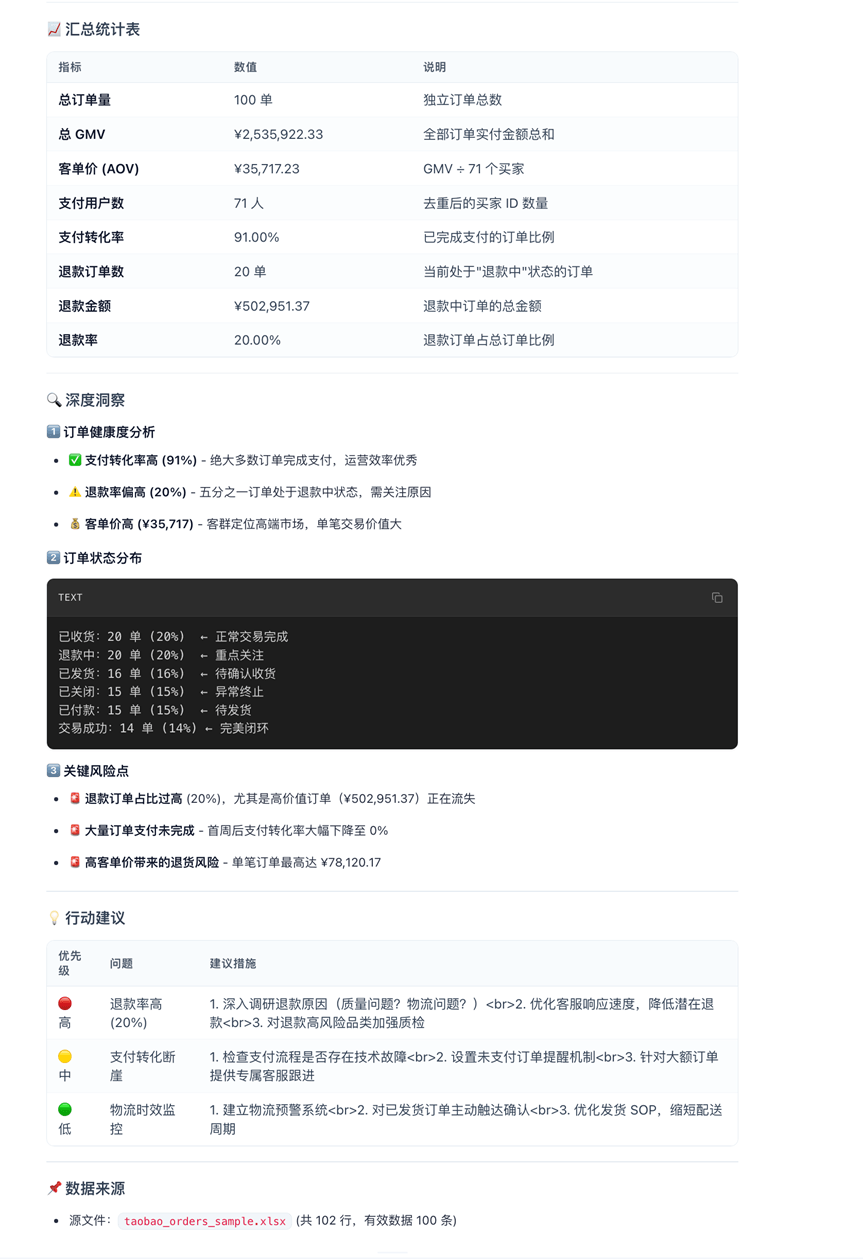
Total orders: 100 orders
Total GMV: ¥2,946,025.51
Number of paying users: 100 people
Overall average order value: ¥29,460.26
Payment conversion rate: 87.00%
Total refunded orders: 18 orders
Total refund amount: ¥482,950.57
Overall refund rate: 18.00%
Singclaw automatically outputs key insights:
- The refund rate is relatively high; focus on investigating after-sales issues for a certain category of products in mid-March
- Payment conversion is good; you can increase traffic acquisition efforts to boost order volume
- The average order value is relatively high, suitable for bundled sales and package optimization
No need to write formulas or make pivot tables throughout the process. Import data → click template → get report, finishing in 3 minutes what used to take most of a day.
5. Why e-commerce people must use Singclaw?
1. Zero threshold: no SQL, no BI, operate through natural language conversation, business staff can use it directly
2. Fully automated: from cleaning to reporting completed with one click, scheduled push, freeing your hands
3. Proactive insights: not only passively querying data, but also proactively discovering anomalies and giving strategies
4. Experience can be accumulated: save your analysis logic as templates, and newcomers can also quickly produce professional reports
5. Full-scenario adaptation: orders, products, users, traffic, advertising, refunds can all be analyzed
6. Data security: your data is under your control, local deployment is more reassuring
6. Some heartfelt suggestions
Singclaw is very powerful, but you cannot completely "leave it all to AI".
The first time you use it, it is recommended to check the core metrics once to ensure consistent definitions, fine-tune templates according to your own store logic, make reports more aligned with actual business, and use automated monitoring more, turn on anomaly alerts, and avoid risks in advance.
Using AI tools well is not about being lazy, but about putting energy into more valuable things. Think about strategy, optimize products, improve conversion, and create growth.
Follow this tutorial once, and you can master Singclaw e-commerce analysis in 30 minutes. Starting today, make data analysis as simple as talking, no longer staying up late to make reports or being stumped by sudden questions, and truly give time back to operations itself.