
What is Infographic
Infographic is a next-generation information graphics framework open-sourced by Alibaba's front-end AntV team. The framework is based on the G2 visualization engine and Ant Design, and can quickly generate high-quality, stable information graphics. Infographic comes with 197 built-in formats, supports AI automatic matching and streaming rendering, and provides a syntax similar to Mermaid to define data. Infographic offers a better choice for developers pursuing reliability and professionalism.
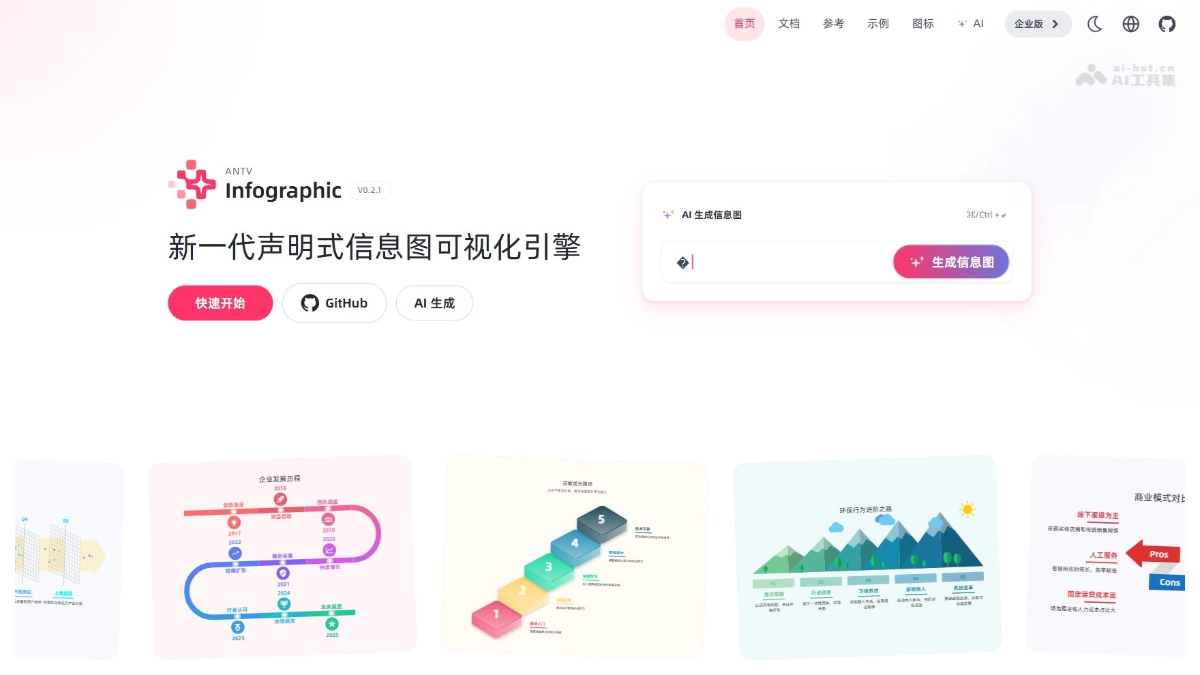
Main features of Infographic
-
Efficient generation of information graphics: Through 197 built-in information graphic templates, users can quickly generate complex metric cards, leaderboards, trend charts, etc., greatly improving the efficiency of creating information graphics.
-
AI-driven: Supports AI automatic matching. Users only need to input content, and the system automatically generates information graphics, including data code definitions, further simplifying the information graphic creation process.
-
Stability and consistency: Compared with AI-generated images, Infographic uses 100% code control, ensuring that every rendering result is completely consistent and meeting the system's requirements for stability.
-
High-quality SVG output: Renders as high-quality SVG format by default, ensuring the visual fidelity of information graphics while also making subsequent editing and modification easier.
-
Powerful theme system: Provides a variety of preset themes such as hand-drawn, gradient, and pattern, supports deep customization, and meets visual needs in different scenarios.
-
Streaming rendering support: Features a highly fault-tolerant syntax, supports AI streaming output and real-time rendering, and adapts to dynamically generated scenarios.
-
Built-in editor: Provides an information graphic editor, making it convenient for users to further modify and optimize AI-generated results.
How to use Infographic
-
Install Infographic: Install via npm
@antv/infographicpackage. -
Initialize the instance: Import Infographic into the project and specify basic configurations such as container, width, and height.
-
Define the information graphic: Use its built-in syntax to describe the content and style of the information graphic, such as selecting templates and defining data.
-
Render the information graphic: Call the
rendermethod to render the defined information graphic onto the page. -
AI automatic generation: Use Infographic's AI tool to automatically generate information graphic code after inputting content, and then render it.
-
Custom adjustments: Modify the style, layout, etc. of the information graphic as needed for deep customization.
-
View templates: Visit the official Infographic example library and choose a suitable template for use.
Infographic project address
- Project official website:https://infographic.antv.vision/
- GitHub repository:https://github.com/antvis/infographic
Application scenarios of Infographic
-
Data analysis and reporting: Used to quickly generate visualization reports for business data such as sales trends and market share, helping management intuitively gain insight into business dynamics.
-
Business intelligence (BI) tools: Embedded in BI platforms to create real-time data dashboards and multi-dimensional data analysis charts, improving the efficiency of data visualization.
-
Education and training: Present complex knowledge or data in infographic form to assist teaching and training and improve the effectiveness of knowledge transfer.
-
News and Media: Embed infographics in news reports and features to help readers understand complex information more intuitively and enhance the appeal of the content.
-
Government and Public Affairs: Used for policy interpretation and public service data display to enhance policy transparency and public understanding.