
What is Data Formulator
Data Formulator is an open-source AI-driven data visualization tool launched by Microsoft Research that helps users quickly create rich data visualizations through simple interactions and instructions. It combines a graphical user interface (GUI) and natural language input (NL), allowing users to design charts through drag-and-drop operations or by directly entering requirements, while AI handles complex data transformations.
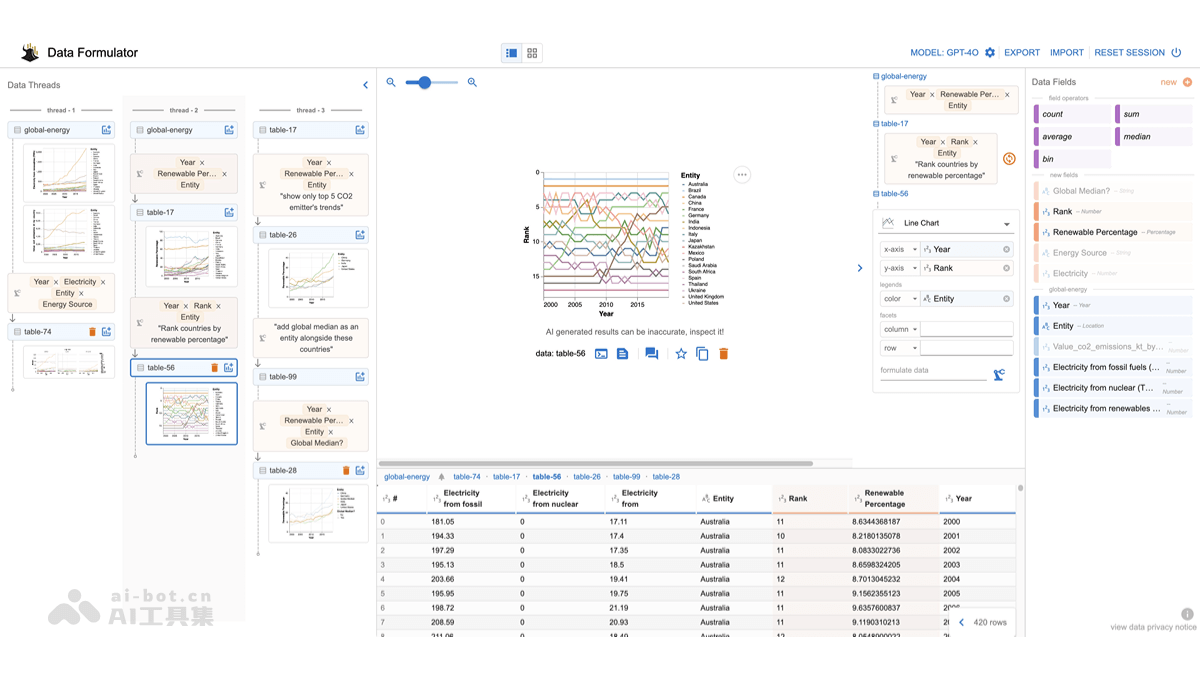
Main features of Data Formulator
- Combines graphical interface and natural language input: Users can drag and drop data fields into chart properties, or describe requirements in natural language, and AI will complete data transformation and visualization according to the instructions.
- Supports complex data transformation: Users can enter names of data fields that do not exist in the encoding shelf, and AI will perform data calculation and transformation according to natural language prompts to generate new visualization content.
- Iterative visualization design: Data Formulator provides a "data thread" feature, allowing users to perform further operations based on existing charts, and AI will update the charts according to natural language instructions.
- Result verification and error correction: Users can view the transformed data, visualization charts, and code generated by AI, and understand the data transformation process through the code explanation module. If errors are found, they can be corrected using the iterative mechanism of the data thread.
- Flexible chart style adjustment: Users can directly adjust chart styles (such as color schemes, axis sorting, etc.) on the concept encoding shelf without additional data transformation, and see visual feedback immediately.
Technical principles of Data Formulator
- Multimodal interactive interface: Data Formulator combines a graphical user interface (GUI) and natural language input (NL). Users can define visualization requirements through drag-and-drop operations or by directly entering natural language instructions. This "two-pronged" approach allows users to choose the operation method according to their habits, whether through interface operations or language descriptions, and can convey requirements efficiently.
- Concept binding and data transformation: Users first define the data concepts they plan to visualize through natural language or examples, and then bind these concepts to visualization channels (such as x-axis, y-axis, color, etc.). Data Formulator will automatically transform the input data into the required format through its AI agent (Agent) and generate the required visualization.
- AI agent and code generation: The backend of Data Formulator uses the Flask framework and receives frontend requests through a RESTful API. When the user clicks the "Formulate" button, the frontend sends a
POSTrequest to the backend's/derive-datainterface. Based on the instructions and data entered by the user, the backend calls an AI agent (such asDataTransformationAgentV2) to generate Python code and executes this code to complete the data transformation. - Data processing and feedback mechanism: Data Formulator provides a data thread feature, allowing users to perform further operations based on existing charts, and AI will update the charts according to natural language instructions. Data Formulator provides a feedback mechanism, allowing users to view the transformed data, visualization charts, and code generated by AI to ensure the results meet expectations.
- Open source and flexibility: Data Formulator is an open-source project. Users can install and run it locally through Python PIP, or use it directly in GitHub Codespaces.
Data Formulator's project address
- Github repository:https://github.com/microsoft/data-formulator
- arXiv technical paper:https://arxiv.org/pdf/2408.16119
Data Formulator's application scenarios
- Data analysis and visualization: Data Formulator can help users quickly transform complex data into intuitive visualization charts. It helps them quickly discover trends and patterns in data.
- Data concept expansion and computation: Users can define nonexistent data concepts through natural language input. For example, when analyzing sustainable energy data, users can add the data concept "sustainable energy percentage" on the y-axis. Even if the original data does not directly provide percentage values, Data Formulator will automatically calculate and generate the corresponding visualization.
- Iteration and optimization: Data Formulator supports iterative design based on existing charts. Users can modify and optimize existing charts through natural language instructions without having to describe the entire design from scratch.
- Multimodal interaction: Users can define visualization requirements through a graphical interface (drag-and-drop operations) or natural language input. This makes Data Formulator suitable for users with different skill levels.