
The Anthropic Economic Index: Tracking AI's Role in the U.S. and Global Economies primarily examines the usage of AI (especially Claude) across the globe and in U.S. states. The report finds that Claude usage in the United States far exceeds that of other countries, with India, Brazil, Japan, and South Korea following closely behind. At the country level, Claude usage is positively correlated with GDP per capita, and high-income countries are more inclined to use Claude for knowledge work rather than purely programming. In the United States, AI usage varies across states due to different economic structures; for example, Washington, D.C. uses it more for document editing, while California leans more toward programming tasks. The report finds that over time, the proportion of tasks automated by Claude rose from 27% to 39%, indicating increasing user trust in AI.
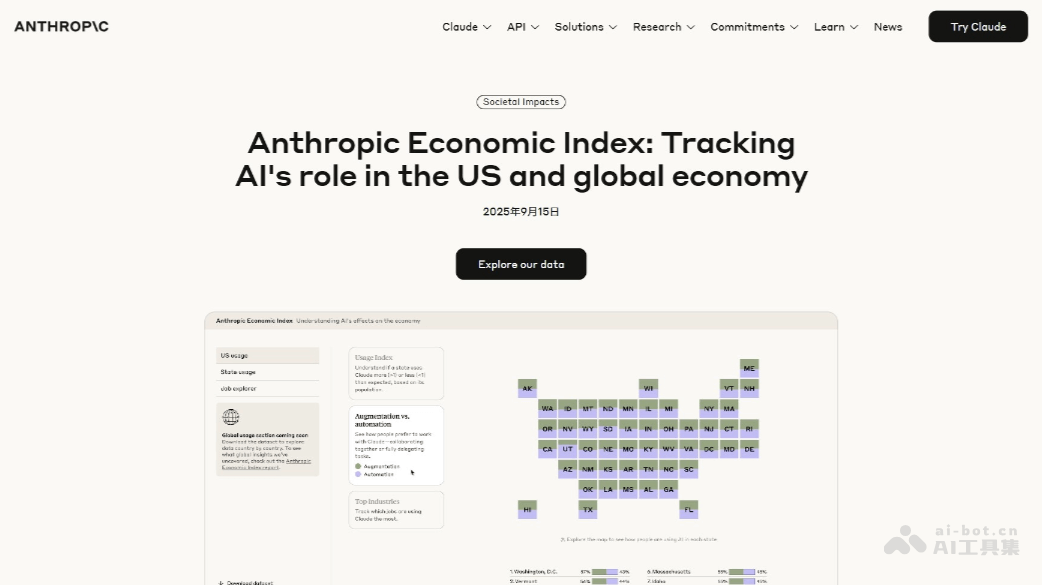
Trip planning in Hawaii, scientific research in Massachusetts, web app development in India—on the surface, the three seem unrelated. In fact,Claude has the widest range of uses in these places。
This does not mean these are Claude's most popular uses: software engineering still holds absolute dominance in almost every state and country worldwide. "Widest rangemeans: users in Massachusetts seek research help at a far higher rate than in other regions, and users in Brazil are especially enthusiastic about language tasks—they use Claude for translation and language learning at six times the global average frequency.
These findings come from our thirdAnthropic Economic Indexreport. In this report, we further track early trends in how AI technology is reshaping work and the economic landscape, focusing on analyzing differences in Claude's applications across different dimensions:
- Comparison across U.S. states: First detailed assessment of interstate differences in AI usage rates. It finds that each state's economic structure directly affects per capita Claude usage, and the states with the highest usage rates are not primarily focused on programming tasks.
- Cross-country comparison: New analysis shows that national income levels are highly correlated with Claude usage intensity, and users in low-income countries are more inclined to use AI to automate work tasks.
- Evolution over time: ComparingDecember 2024-January 2025withFebruary-March 2025data reveals that the share of "instruction-based automation" tasks surged from 27% to 39%, indicating a rapid increase in the responsibilities AI takes on (and user trust).
- Enterprise users: Newly added anonymized data from Anthropic first-party API customers (coveringClaude.aiusers outside of it), revealing enterprise usage patterns for the first time: API users are significantly more inclined toward automated tasks than consumers, foreshadowing major changes that may be coming to the labor market.
Below is the core summary of the report. We have also launched aninteractive website, where you can independently queryClaude.aiusage trends across all U.S. states and all tracked occupations, and observe AI usage in your location or relevant industry. For in-depth research, we fully disclose the datasets for this and previous Economic Index reports.
Geographic analysis
This index adds geographic dimension data for the first time, revealing the application characteristics of Claude in countries around the world and in U.S. states.
Cross-country patterns
Claude usage in the United States is far ahead, with India in second place, and Brazil, Japan, and South Korea having similar usage shares.
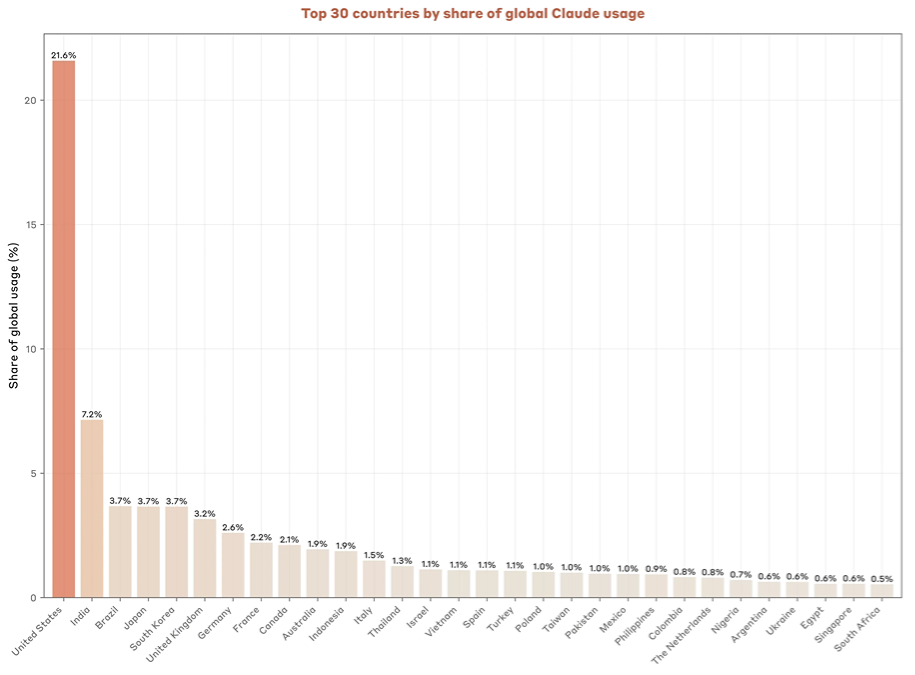
Considering differences in population size across countries, we use the "Anthropic AI Usage Index (AUI)" for adjusted analysis: AUI>1 indicates that a country's per capita usage is higher than expected based on its working-age population.
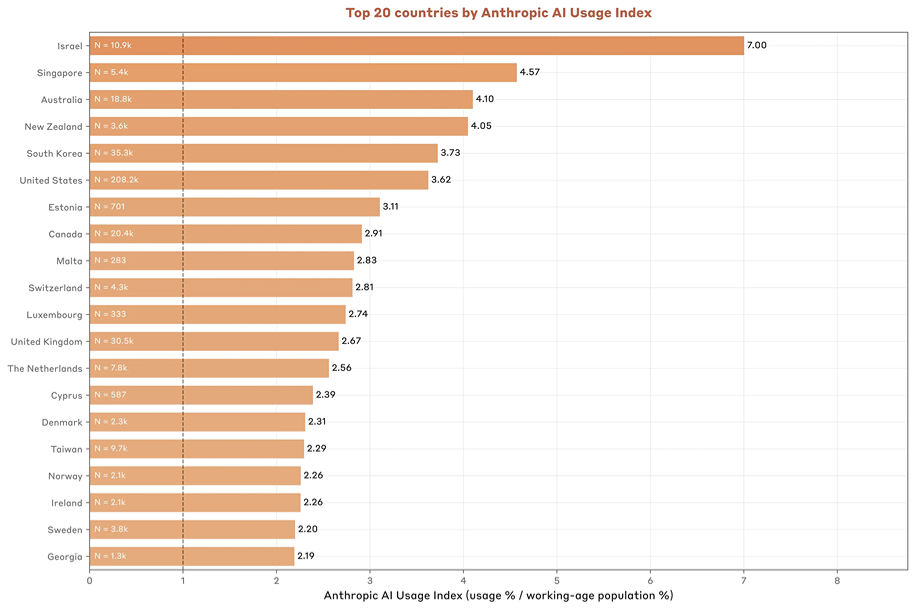
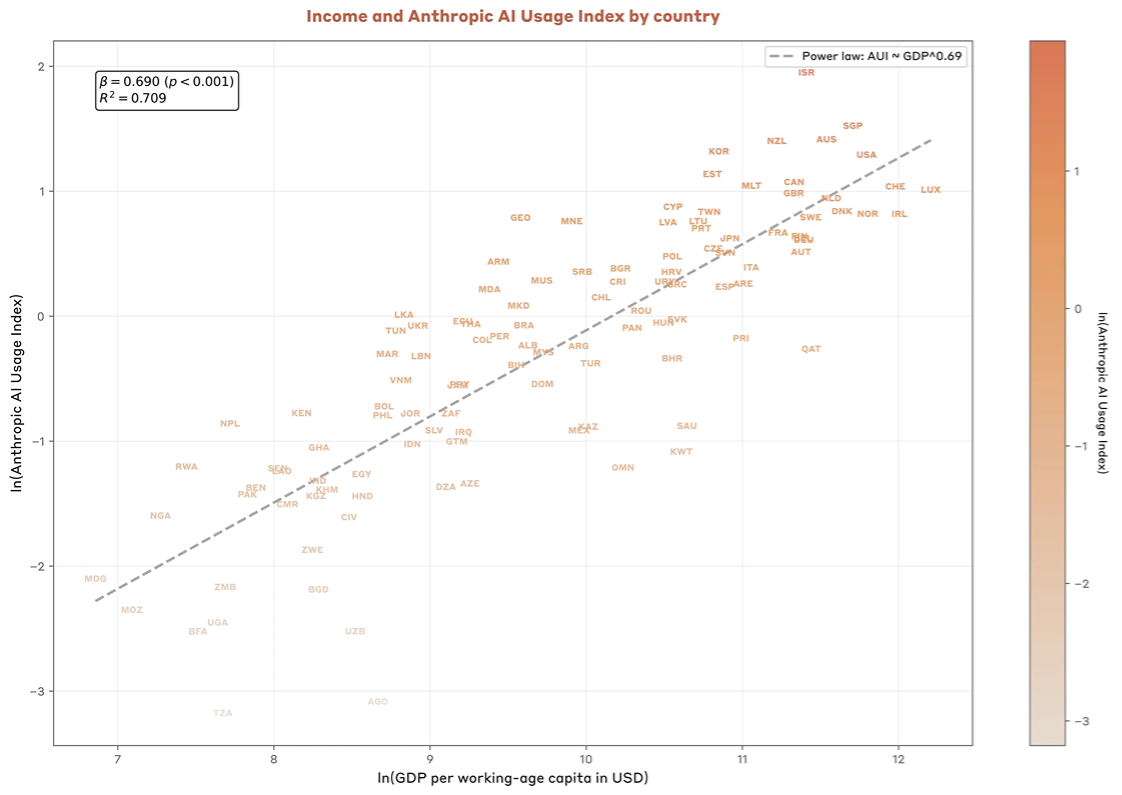
Data shows that technologically advanced small economies (such as Israel and Singapore) lead in Claude adoption rates relative to the working-age population. Income may be a key factor: GDP per capita shows a strong correlation with the AUI index (for every 1% increase in GDP per capita, AUI increases by 0.7%). This makes sense—countries with high Claude usage typically have well-developed internet infrastructure and industries dominated by a knowledge-based economy. It also raises concerns about economic divergence: history shows that general-purpose technologies such as electrification and the internal combustion engine drove economic growth while also widening global gaps in living standards. If AI benefits are concentrated in high-income countries, similar economic divergence effects could re-emerge.
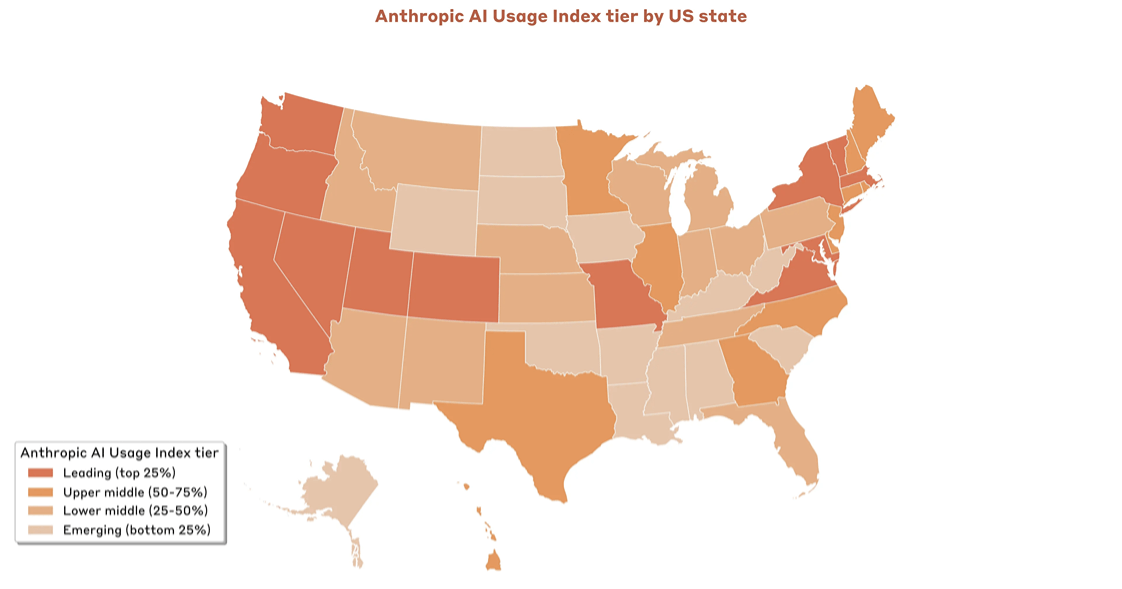
Interstate Patterns in the United States
The positive correlation between GDP per capita and Claude usage also holds at the U.S. state level, and the correlation is even stronger (for every 1% increase in GDP per capita, per capita usage increases by 1.8%). However, income explains less than it does in cross-country data, indicating the presence of other influencing factors.
We speculate that each state's economic structure is the main factor. The highest AUI in the United States is Washington, D.C. (3.82), where Claude's most frequent uses are editing documents and searching for information, along with other tasks related to knowledge work in Washington, D.C. Likewise, coding-related tasks are [most frequent] in California (the state with the third-highest overall AUI).
Even in low-usage states such as Hawaii, the frequency of tourism-related task usage is twice the national average. More data can be found through theinteractive websiteExplore.
Trends in Claude Usage
Since December 2024, we have been tracking how people use Claude. We use a privacy-preservingclassification method, to classify anonymized conversation records by task groups defined by O*NET (a U.S. government database used to classify occupations and related tasks). Throughthis approach, we can analyze how the tasks people assign to Claude have changed since last year, and how the ways people choose to collaborate (how much oversight and input they choose to put into Claude's work) have also changed.
Task Types
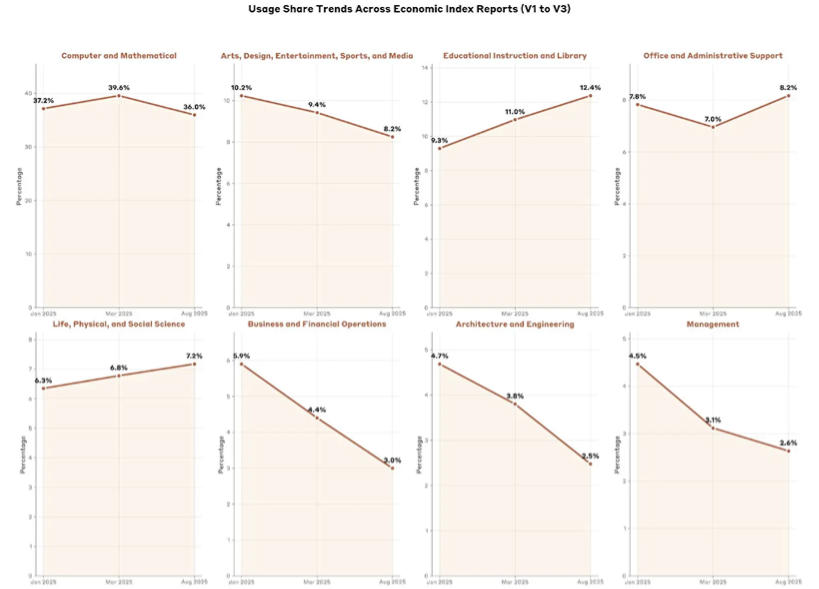
Since December 2024, computer and mathematical uses of Claude have dominated our categories, accounting for approximately 37-40% of conversations.
But the situation has changed considerably. Over the past nine months, we have seen continued growth in "knowledge-intensive" fields. For example, educational instruction tasks increased by more than 40% (rising from 9% to 13% of all conversations), and the proportion of tasks related to physical and social sciences increased by one-third (from 6% to 8%). At the same time, the relative frequency of traditional business tasks has declined: management-related tasks fell from 5% to 3% of all conversations, and tasks related to business and financial operations were halved, from 6% to 3%. (Of course, in absolute terms, the number of conversations in each category still increased significantly.)
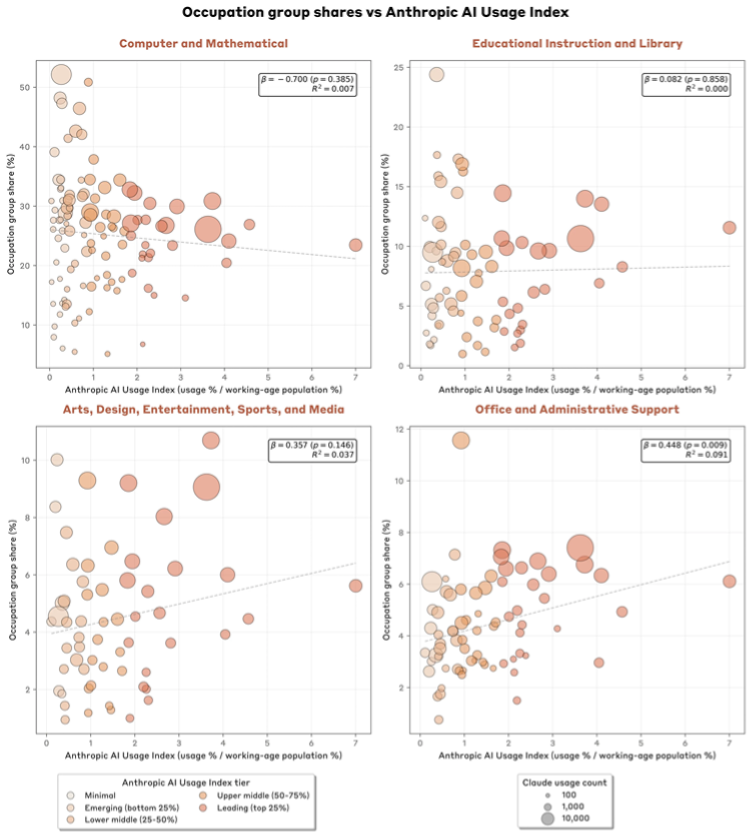
The overall trend shows that as a country's GDP per capita rises, Claude usage shifts from computer/mathematical tasks to diversified scenarios such as education, art and design, administrative support, and scientific research. Software development remains the most frequent application in all countries, and U.S. states show a similar pattern, although our sample size limits our ability to explore in more detail how task mixes vary with adoption rates.
Interaction Modes
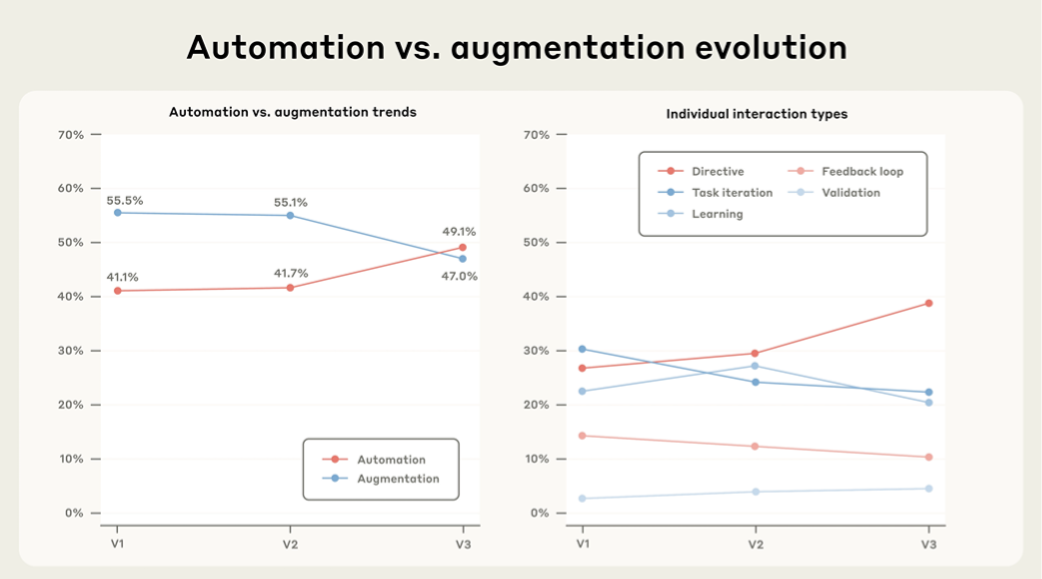
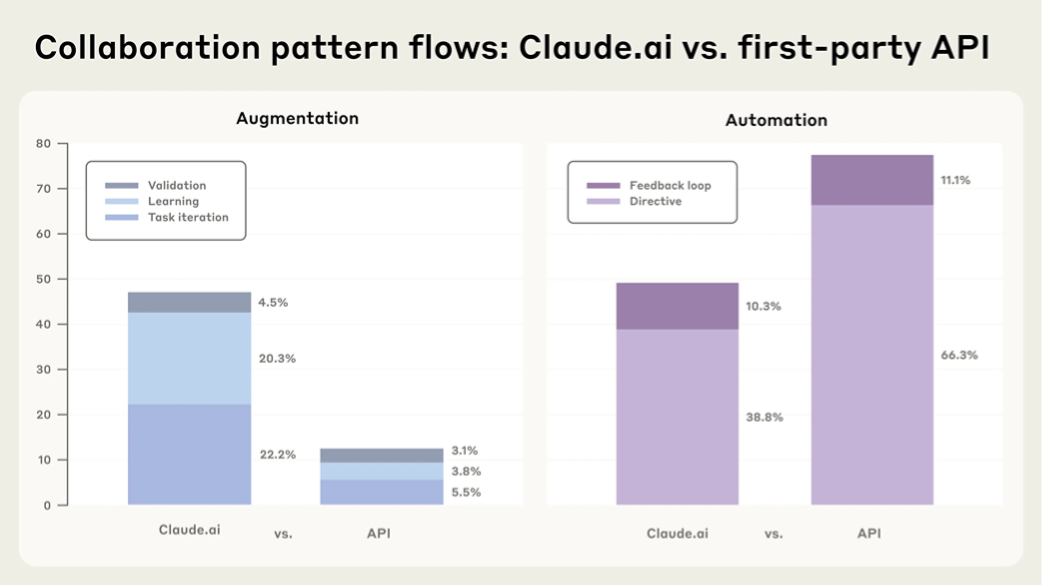
As wepreviouslymentioned,we divide AI applications intoautomation(AI directly produces output with minimal human intervention) andaugmentation(Human-AI collaboration), we further subdivide automation into directive conversation and feedback loop interaction, where directive conversation involves minimal human-AI interaction, while in feedback loop tasks, humans feed real-world outcomes back to the model. We also subdivide augmentation into learning (requesting information or explanations), task iteration (collaborating with Claude), and validation (requesting feedback).
Since December 2024, the share of directive conversation has surged from 27% to 39%, while other modes (especially learning, task iteration, and feedback loops) have declined slightly, driving the total share of automation (49.1%) to surpass augmentation (47%) for the first time. This indicates that AI is rapidly gaining user trust, with increased autonomy to take on more complex work.
Upgrades in model capabilities may be the main reason (in December 2024, when we first collected Economic Index data, the latest version of Claude was Sonnet 3.6). As models become increasingly better at predicting user needs and generating high-quality results, users may be more willing to trust the model's output on the first attempt.
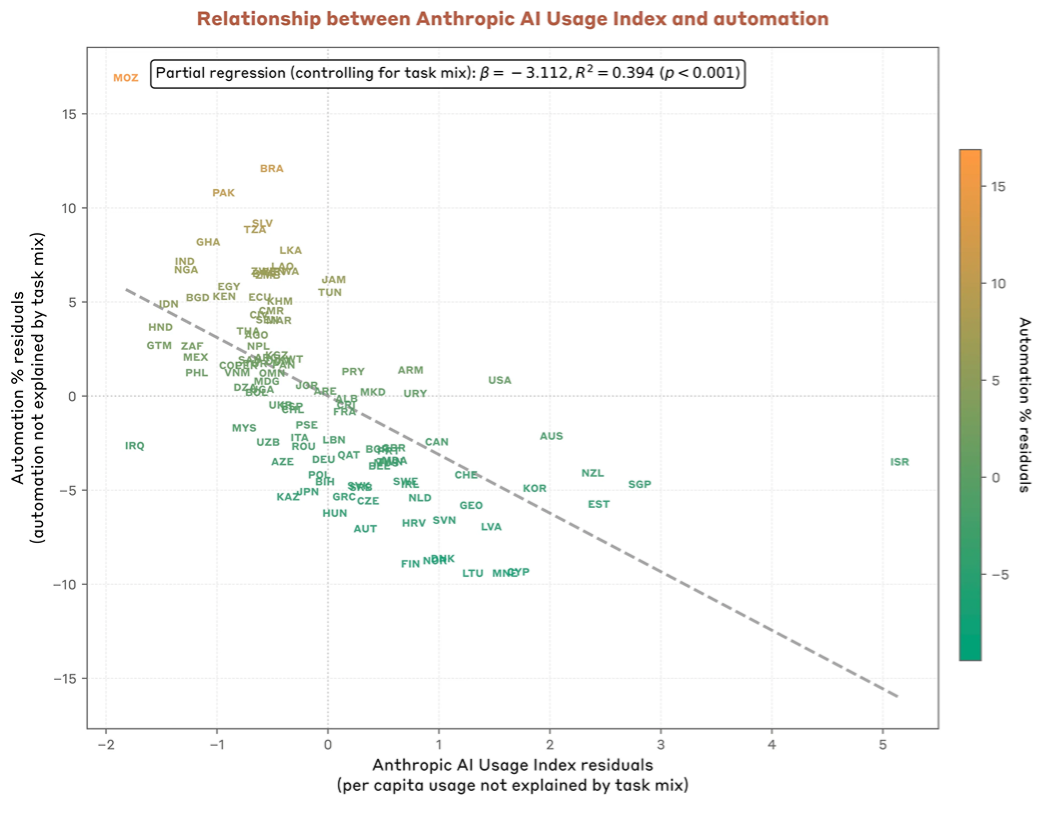
A counterintuitive phenomenon is that high-usage countries tend to favor augmentation mode, while low-usage countries prefer automation; when controlling for the relevant task mix, for every 1% increase in per capita usage, the automation rate decreases by about 3%. The reasons remain unclear and may be related to cultural differences among early users in different countries or economic factors.
Enterprise Applications
Using the same privacy protection methods as conversations on Claude.ai, we sampled interactions from a subset of Anthropic's first-party API customers, a pioneering analysis. API customers tend to be enterprises and developers, who use Claude in ways very different from those who access Claude through Claude.ai: they pay by token rather than a fixed monthly subscription, and can issue requests through their own programs.
These customers' use of Claude is especially concentrated in coding and administrative tasks: 44% of API traffic in our sample maps to computer or math tasks, whereason Claude.ai this proportion is 36%. (In fact, about 5% of API traffic is specifically for developing and evaluating AI systems.) The proportion of conversations related to educational occupations (4% for API, Claude.ai12%) and the proportion related to arts and entertainment (5% for API, 8% for Claude.ai) are relatively small, offsetting the difference.
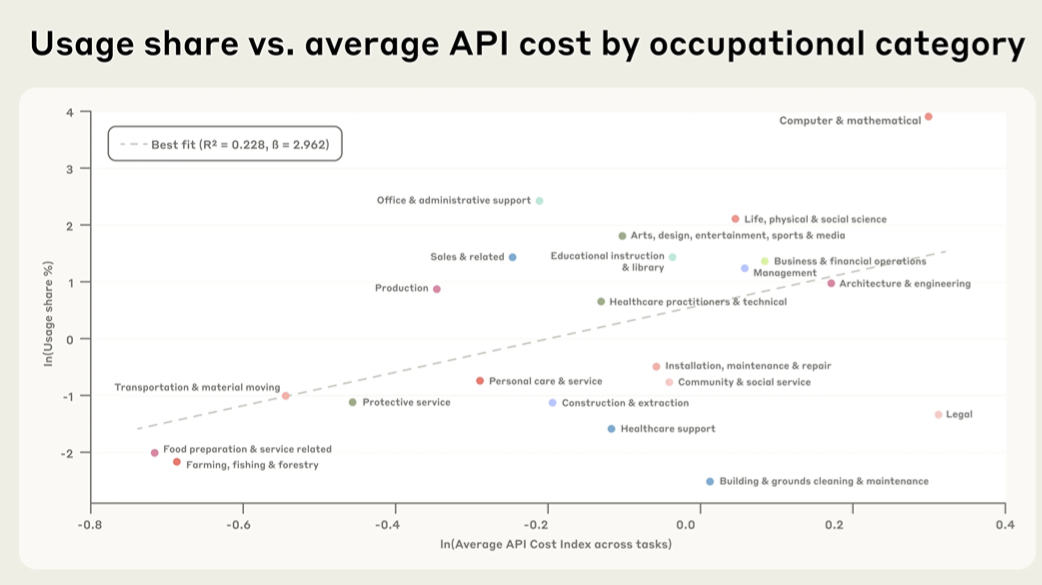
Finally, given the payment method for API usage, we explored whether differences in task cost (caused by differences in the number of tokens consumed) affect which tasks enterprises choose to "purchase." We found that task cost is positively correlated with usage frequency: task categories with higher costs tend to be used more frequently, as shown in the figure below. This indicates that, for enterprises, the model's basic functions and the economic value it generates are more important than the cost of completing the task itself.
Conclusion
The Economic Index aims to empirically assess the early manifestations of AI's impact on employment and the economy. We found that AI adoption shows significant imbalance: users in high-income countries are more inclined to use Claude, more likely to pursue collaboration rather than automation, and their application scenarios go beyond programming. At the U.S. state level, usage is closely tied to the local dominant industry (from technology to tourism), and enterprises are more willing than consumers to grant Claude autonomy.
Particularly noteworthy is that over the past nine months, the share of directive automated conversations on Claude.ai has risen sharply. Users are still exploring the boundaries of collaboration with AI—we are still collectively defining the trust threshold and allocation of responsibility for AI tools. But current trends suggest that humans are becoming increasingly comfortable with AI agents working. We will continue to track this evolution and observe whether user behavior stabilizes as model capabilities improve.
Welcome to the Anthropic Economic Index website to explore interactive data visualizations (covering country, state, and occupation dimensions). We will continue to update the data for the public to track the pathways of AI's impact on the economy and employment.
Open Data
As with previous reports, this issue simultaneously releases the complete dataset, which includes geographic data, task-level usage patterns, a breakdown of automation/augmentation features by task, and an overview of API usage. The data can be found atEconomic Index websitedownload.
Official report website
- Report official website:https://www.anthropic.com/research/economic-index-geography
- Interactive website:https://www.anthropic.com/economic-index