
What is AgentCanvas
AgentCanvas is Vstorm's open-source visualization tool for Pydantic AI. It can automatically turn the run logs of AI Agents already connected to Logfire tracing into an interactive HTML flowchart report, clearly showing every model call, tool execution, nested sub-agent, token consumption, and exact cost. The output is a single self-contained HTML file that can be viewed offline without a server, making it especially suitable for clearly explaining "what the AI actually did" when presenting to clients.
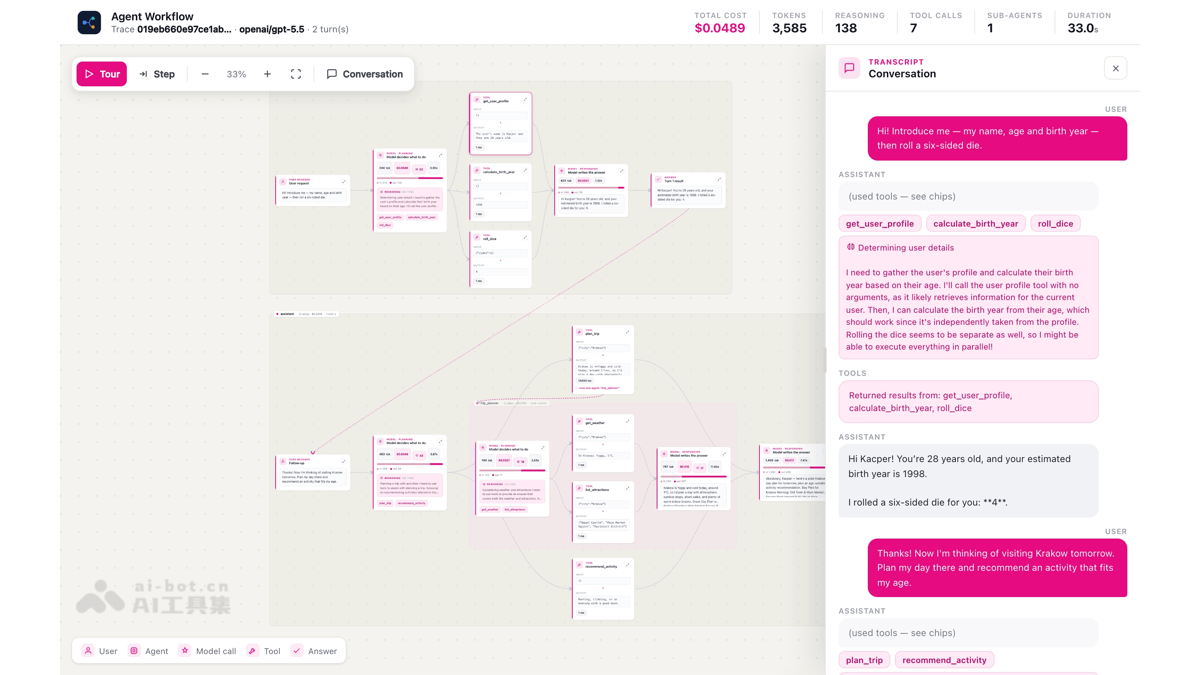
Main features of AgentCanvas
-
Block-style flowchart: Presents the complete Agent run chain in a
User → Agent → Model → Tools → Answerstreaming structure, supporting canvas panning, zooming, and dragging. -
Recursive display of nested sub-agents: When a tool itself is another Agent, it automatically draws a nested frame, supporting recursive expansion to any depth.
-
Complete conversation records: Each round of conversation becomes an independent frame, and the sidebar displays the complete
user → assistant → user → assistantraw transcript. -
Visualization of the reasoning process: Displays a summary of the model's "thinking" and the number of reasoning tokens, attached to each model call node and conversation record.
-
Accurate cost calculation: Based on the
genai-priceslibrary, it calculates the actual USD cost separately for each model call and for the overall run. -
Token usage statistics: Displays the number of Input / Output / Reasoning Tokens layer by layer, and summarizes the total.
-
In-depth details panel: Click through to view metadata such as Provider, Finish Reason, Response ID, list and descriptions of available tools, output mode, and Thinking configuration.
-
Guided demo mode: Supports two modes,autoplayandmanual step-by-step(Space/click/arrow keys, with back navigation), accompanied by natural-language narration, making client demos convenient.
-
Single-file self-contained output: The final output is a single HTML file, requiring no build, no server, capable of running offline, and easy to send by email.

Follow WeChat and reply "open source" to join theAI Open Source Project Communication Group
How to use AgentCanvas
-
Install the tool: Install with one click via pip
pip install agentcanvas。 -
Configure the read token: Set the environment variable
LOGFIRE_READ_TOKEN(or write it to a.envfile), used to read Agent run tracing data through the Logfire Query API. -
(Optional) Configure the region address: If you need to read Logfire data in the EU region, set
LOGFIRE_BASE_URL=https://logfire-eu.pydantic.dev。 -
Generate the latest run report: Execute the
agentcanvascommand, automatically read the latest Agent run record, output it asagent_flow.htmland open it in the browser. -
View the list of historical runs: Execute
agentcanvas --listto list all recently available run records. -
Visualize a specific Trace: Execute
agentcanvas --trace-id <id>to generate a flowchart for a specific run. -
Customize the output file name: Execute
agentcanvas -o report.html --no-opento specify the output filename and disable automatic browser opening. -
(Optional) Run the example Agent: In the repository directory, execute
uv sync --all-extras --prerelease=allowanduv run --prerelease=allow python assets/scripts/main.pyto generate example trace data, then executeagentcanvasfor visualization. -
Library mode integration: Import
LogfireClient、parse_run、render_htmlin Python code to programmatically obtain Trace data and render it as an HTML string written to a file.
AgentCanvas project address
- Github repository:https://github.com/vstorm-co/agentcanvas
AgentCanvas core advantages
-
Zero-intrusion visualization: No need to modify existing Agent code; directly reads existing OpenTelemetry GenAI spans data from Logfire
-
Production-grade cost transparency: Calculates exact costs based on real Token data, solving the pain points of the "AI black box" and "uncontrollable costs"
-
A powerful customer communication tool: Translates technical implementation into business language, enabling non-technical customers to understand the Agent's decision path and tool-calling logic
-
Native support for recursive architecture: Unlike ordinary flowchart tools, it has native recursive rendering capability for Pydantic AI's nested sub-Agent pattern
-
MIT open source license: Can be freely integrated into internal toolchains or commercial projects
Comparison of AgentCanvas with similar competing products
| Comparison dimension | AgentCanvas | LangSmith | Phoenix (Arize) |
|---|---|---|---|
| Core positioning | Visualization report generation dedicated to Pydantic AI | Full-chain tracing and evaluation for the LangChain ecosystem | LLM observability and evaluation across multiple frameworks |
| Visualization form | Single-file interactive HTML flowchart (offline capable) | Online Web platform (login required) | Online Web platform (login required) |
| Cost display | ✅ Precise USD cost for each call | ⚠️ Token statistics; cost requires additional configuration | ⚠️ Token statistics; cost requires additional configuration |
| Nested Agent support | ✅ Native recursive rendering | ⚠️ Supported but not specifically optimized | ⚠️ Supported but not specifically optimized |
| Deployment method | Local CLI tool, outputs a single HTML | SaaS platform + local SDK | SaaS platform + local SDK |
| Open source license | MIT | Partially open source (LangSmith is closed source) | Apache 2.0 |
| Pydantic AI native | ✅ Deep integration | ⚠️ General compatibility | ⚠️ General compatibility |
| Demo mode | ✅ Automatic guided tour + manual step-by-step | ❌ None | ❌ None |
AgentCanvas application scenarios
-
Customer Demo and reporting: Directly show the Agent's complete decision chain, tool-calling sequence, and real-time cost during meetings to build customer trust.
-
Production environment debugging: Quickly locate through visualization at which step the Agent called the wrong tool or produced abnormally high Token consumption.
-
Cost auditing and optimization: Based on cost data accurate to each model call, identify high-consumption steps and optimize prompts or model selection.
-
Agent architecture documentation: Use the actual runtime flowchart as technical documentation or a deliverable, replacing static architecture diagrams.
-
Multi-agent system monitoring: In complex nested Agent systems, recursively visualize the call relationships at each level to avoid "Russian nesting doll"-style black boxes.